Israeli vs Immigrants from Micronesia Single Mother Households
COMPARE
Israeli
Immigrants from Micronesia
Single Mother Households
Single Mother Households Comparison
Israelis
Immigrants from Micronesia
5.7%
SINGLE MOTHER HOUSEHOLDS
97.4/ 100
METRIC RATING
88th/ 347
METRIC RANK
6.9%
SINGLE MOTHER HOUSEHOLDS
3.6/ 100
METRIC RATING
223rd/ 347
METRIC RANK
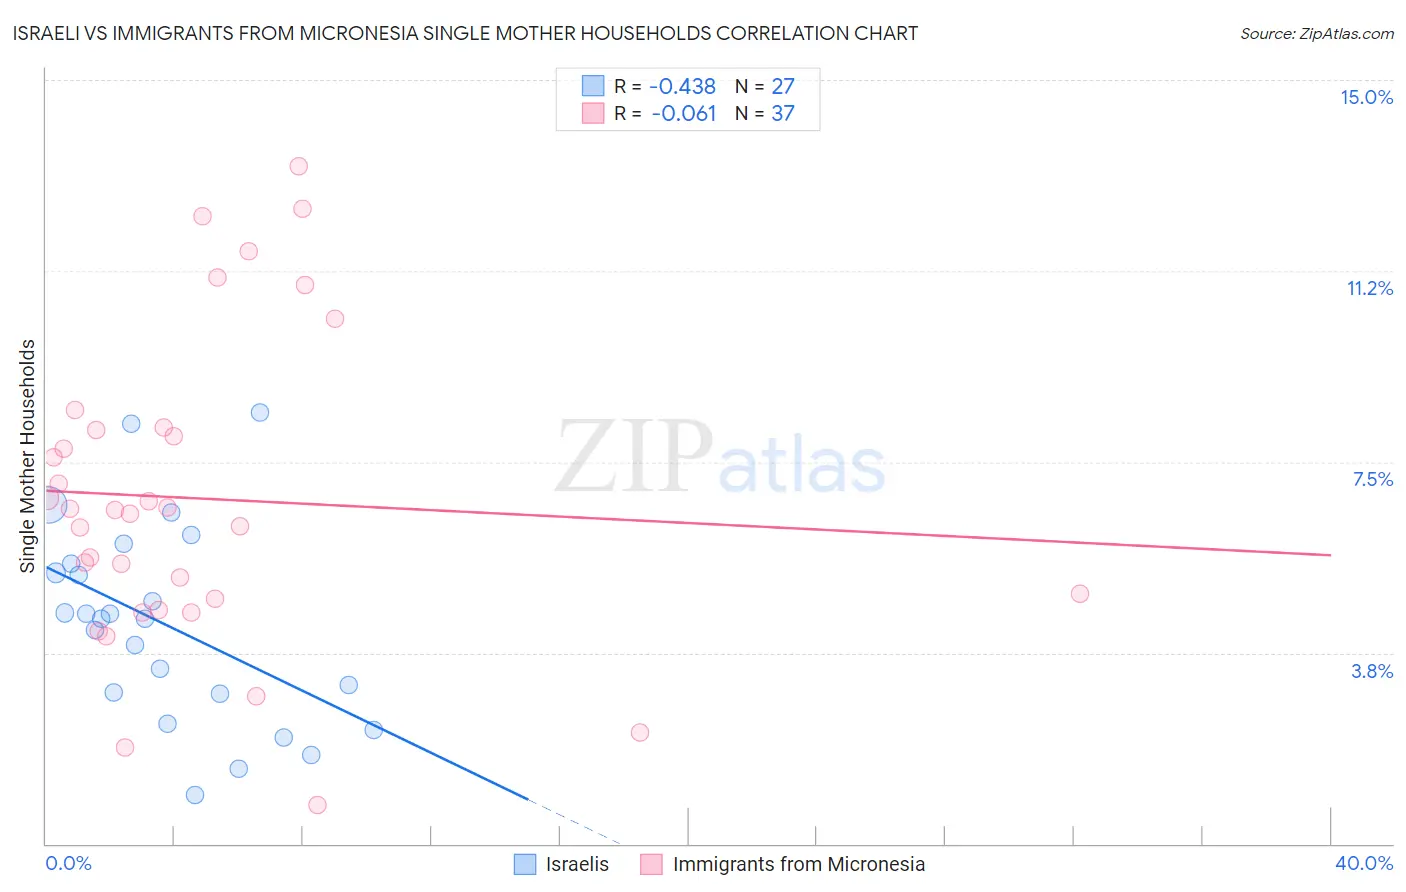
Israeli vs Immigrants from Micronesia Single Mother Households Correlation Chart
The statistical analysis conducted on geographies consisting of 210,568,675 people shows a moderate negative correlation between the proportion of Israelis and percentage of single mother households in the United States with a correlation coefficient (R) of -0.438 and weighted average of 5.7%. Similarly, the statistical analysis conducted on geographies consisting of 61,584,620 people shows a slight negative correlation between the proportion of Immigrants from Micronesia and percentage of single mother households in the United States with a correlation coefficient (R) of -0.061 and weighted average of 6.9%, a difference of 21.0%.
Single Mother Households Correlation Summary
| Measurement | Israeli | Immigrants from Micronesia |
| Minimum | 0.95% | 0.77% |
| Maximum | 8.5% | 13.3% |
| Range | 7.5% | 12.5% |
| Mean | 4.3% | 6.8% |
| Median | 4.4% | 6.5% |
| Interquartile 25% (IQ1) | 3.0% | 4.7% |
| Interquartile 75% (IQ3) | 5.5% | 8.1% |
| Interquartile Range (IQR) | 2.6% | 3.4% |
| Standard Deviation (Sample) | 1.9% | 3.0% |
| Standard Deviation (Population) | 1.9% | 3.0% |
Similar Demographics by Single Mother Households
Demographics Similar to Israelis by Single Mother Households
In terms of single mother households, the demographic groups most similar to Israelis are Immigrants from Turkey (5.7%, a difference of 0.070%), Finnish (5.7%, a difference of 0.15%), Hungarian (5.7%, a difference of 0.18%), Ukrainian (5.7%, a difference of 0.26%), and Immigrants from Indonesia (5.7%, a difference of 0.32%).
| Demographics | Rating | Rank | Single Mother Households |
| Immigrants | Moldova | 97.9 /100 | #81 | Exceptional 5.6% |
| Immigrants | Malaysia | 97.8 /100 | #82 | Exceptional 5.7% |
| Immigrants | Hungary | 97.8 /100 | #83 | Exceptional 5.7% |
| Carpatho Rusyns | 97.7 /100 | #84 | Exceptional 5.7% |
| Hungarians | 97.6 /100 | #85 | Exceptional 5.7% |
| Finns | 97.6 /100 | #86 | Exceptional 5.7% |
| Immigrants | Turkey | 97.5 /100 | #87 | Exceptional 5.7% |
| Israelis | 97.4 /100 | #88 | Exceptional 5.7% |
| Ukrainians | 97.2 /100 | #89 | Exceptional 5.7% |
| Immigrants | Indonesia | 97.2 /100 | #90 | Exceptional 5.7% |
| Europeans | 97.0 /100 | #91 | Exceptional 5.7% |
| Immigrants | Western Asia | 96.7 /100 | #92 | Exceptional 5.7% |
| Serbians | 96.7 /100 | #93 | Exceptional 5.7% |
| Basques | 96.7 /100 | #94 | Exceptional 5.7% |
| Slovaks | 96.6 /100 | #95 | Exceptional 5.7% |
Demographics Similar to Immigrants from Micronesia by Single Mother Households
In terms of single mother households, the demographic groups most similar to Immigrants from Micronesia are Immigrants from Bangladesh (6.9%, a difference of 0.050%), French American Indian (6.9%, a difference of 0.070%), Immigrants from Sudan (6.9%, a difference of 0.12%), Immigrants from Thailand (6.9%, a difference of 0.26%), and Sudanese (6.9%, a difference of 0.39%).
| Demographics | Rating | Rank | Single Mother Households |
| Cherokee | 5.1 /100 | #216 | Tragic 6.8% |
| Aleuts | 4.8 /100 | #217 | Tragic 6.8% |
| Immigrants | Eastern Africa | 4.4 /100 | #218 | Tragic 6.8% |
| Immigrants | Immigrants | 4.3 /100 | #219 | Tragic 6.8% |
| Immigrants | Thailand | 4.0 /100 | #220 | Tragic 6.9% |
| French American Indians | 3.7 /100 | #221 | Tragic 6.9% |
| Immigrants | Bangladesh | 3.7 /100 | #222 | Tragic 6.9% |
| Immigrants | Micronesia | 3.6 /100 | #223 | Tragic 6.9% |
| Immigrants | Sudan | 3.5 /100 | #224 | Tragic 6.9% |
| Sudanese | 3.1 /100 | #225 | Tragic 6.9% |
| Paiute | 2.4 /100 | #226 | Tragic 7.0% |
| Kenyans | 2.3 /100 | #227 | Tragic 7.0% |
| Iroquois | 2.2 /100 | #228 | Tragic 7.0% |
| Immigrants | Kenya | 2.1 /100 | #229 | Tragic 7.0% |
| Creek | 1.6 /100 | #230 | Tragic 7.0% |