Yakama vs Immigrants from Micronesia Master's Degree
COMPARE
Yakama
Immigrants from Micronesia
Master's Degree
Master's Degree Comparison
Yakama
Immigrants from Micronesia
9.5%
MASTER'S DEGREE
0.0/ 100
METRIC RATING
340th/ 347
METRIC RANK
10.8%
MASTER'S DEGREE
0.0/ 100
METRIC RATING
320th/ 347
METRIC RANK
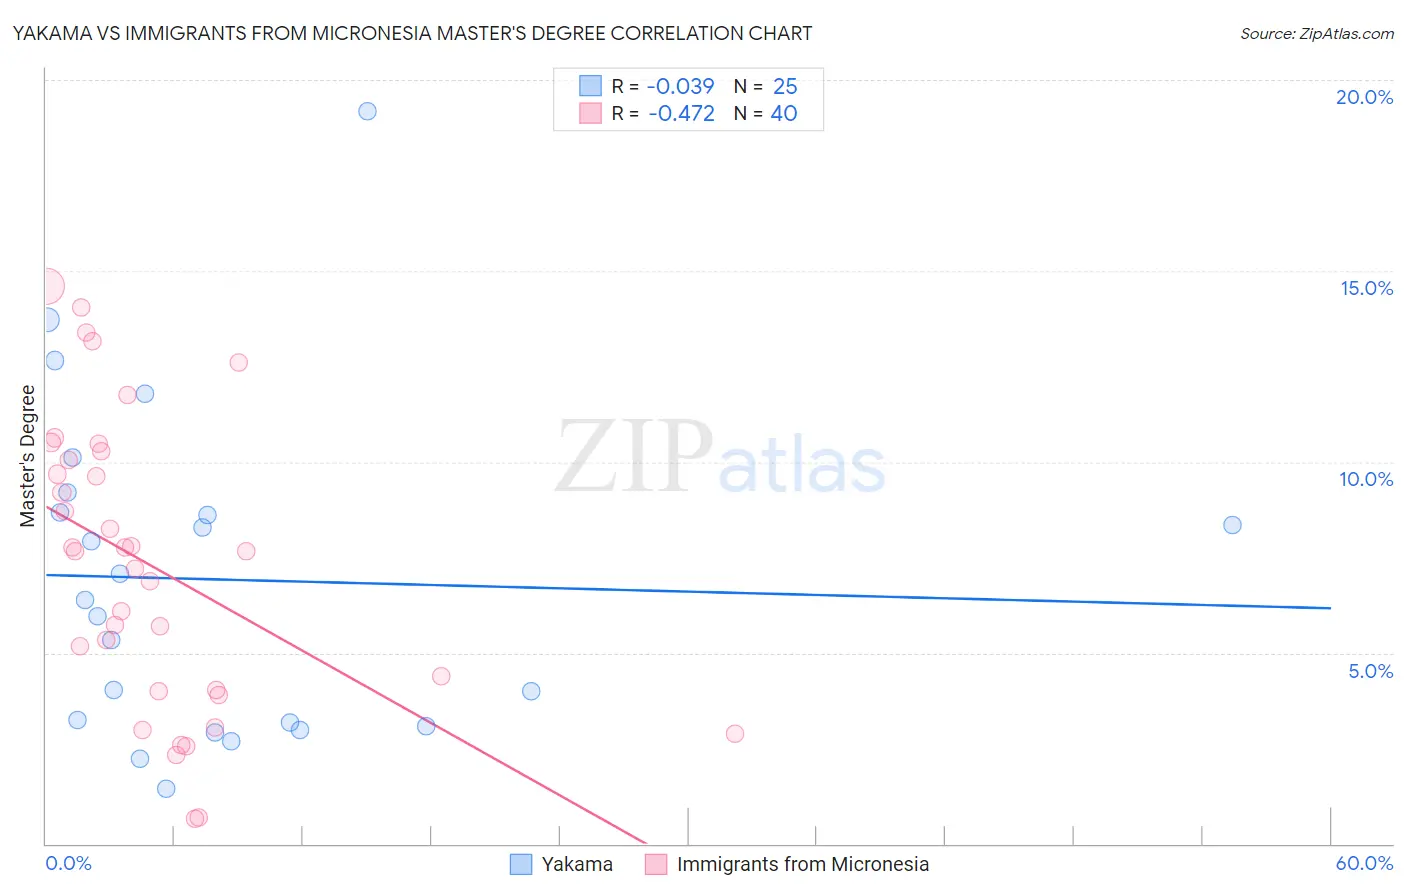
Yakama vs Immigrants from Micronesia Master's Degree Correlation Chart
The statistical analysis conducted on geographies consisting of 19,918,334 people shows no correlation between the proportion of Yakama and percentage of population with at least master's degree education in the United States with a correlation coefficient (R) of -0.039 and weighted average of 9.5%. Similarly, the statistical analysis conducted on geographies consisting of 61,602,639 people shows a moderate negative correlation between the proportion of Immigrants from Micronesia and percentage of population with at least master's degree education in the United States with a correlation coefficient (R) of -0.472 and weighted average of 10.8%, a difference of 13.8%.
Master's Degree Correlation Summary
| Measurement | Yakama | Immigrants from Micronesia |
| Minimum | 1.4% | 0.67% |
| Maximum | 19.2% | 14.6% |
| Range | 17.7% | 13.9% |
| Mean | 6.9% | 7.3% |
| Median | 6.4% | 7.7% |
| Interquartile 25% (IQ1) | 3.1% | 4.0% |
| Interquartile 75% (IQ3) | 8.9% | 10.2% |
| Interquartile Range (IQR) | 5.8% | 6.1% |
| Standard Deviation (Sample) | 4.3% | 3.8% |
| Standard Deviation (Population) | 4.2% | 3.7% |
Demographics Similar to Yakama and Immigrants from Micronesia by Master's Degree
In terms of master's degree, the demographic groups most similar to Yakama are Spanish American Indian (9.6%, a difference of 1.2%), Tohono O'odham (9.7%, a difference of 2.6%), Mexican (9.7%, a difference of 2.6%), Native/Alaskan (9.9%, a difference of 5.0%), and Immigrants from Central America (10.0%, a difference of 5.5%). Similarly, the demographic groups most similar to Immigrants from Micronesia are Pennsylvania German (10.7%, a difference of 0.21%), Sioux (10.7%, a difference of 0.85%), Crow (10.6%, a difference of 1.2%), Dutch West Indian (10.6%, a difference of 1.3%), and Inupiat (10.5%, a difference of 2.4%).
| Demographics | Rating | Rank | Master's Degree |
| Immigrants | Micronesia | 0.0 /100 | #320 | Tragic 10.8% |
| Pennsylvania Germans | 0.0 /100 | #321 | Tragic 10.7% |
| Sioux | 0.0 /100 | #322 | Tragic 10.7% |
| Crow | 0.0 /100 | #323 | Tragic 10.6% |
| Dutch West Indians | 0.0 /100 | #324 | Tragic 10.6% |
| Inupiat | 0.0 /100 | #325 | Tragic 10.5% |
| Creek | 0.0 /100 | #326 | Tragic 10.5% |
| Paiute | 0.0 /100 | #327 | Tragic 10.5% |
| Bangladeshis | 0.0 /100 | #328 | Tragic 10.5% |
| Nepalese | 0.0 /100 | #329 | Tragic 10.5% |
| Fijians | 0.0 /100 | #330 | Tragic 10.3% |
| Pueblo | 0.0 /100 | #331 | Tragic 10.3% |
| Immigrants | Azores | 0.0 /100 | #332 | Tragic 10.2% |
| Menominee | 0.0 /100 | #333 | Tragic 10.2% |
| Arapaho | 0.0 /100 | #334 | Tragic 10.0% |
| Immigrants | Central America | 0.0 /100 | #335 | Tragic 10.0% |
| Natives/Alaskans | 0.0 /100 | #336 | Tragic 9.9% |
| Mexicans | 0.0 /100 | #337 | Tragic 9.7% |
| Tohono O'odham | 0.0 /100 | #338 | Tragic 9.7% |
| Spanish American Indians | 0.0 /100 | #339 | Tragic 9.6% |
| Yakama | 0.0 /100 | #340 | Tragic 9.5% |