Israeli vs Czech No Schooling Completed
COMPARE
Israeli
Czech
No Schooling Completed
No Schooling Completed Comparison
Israelis
Czechs
1.9%
NO SCHOOLING COMPLETED
92.4/ 100
METRIC RATING
127th/ 347
METRIC RANK
1.5%
NO SCHOOLING COMPLETED
100.0/ 100
METRIC RATING
26th/ 347
METRIC RANK
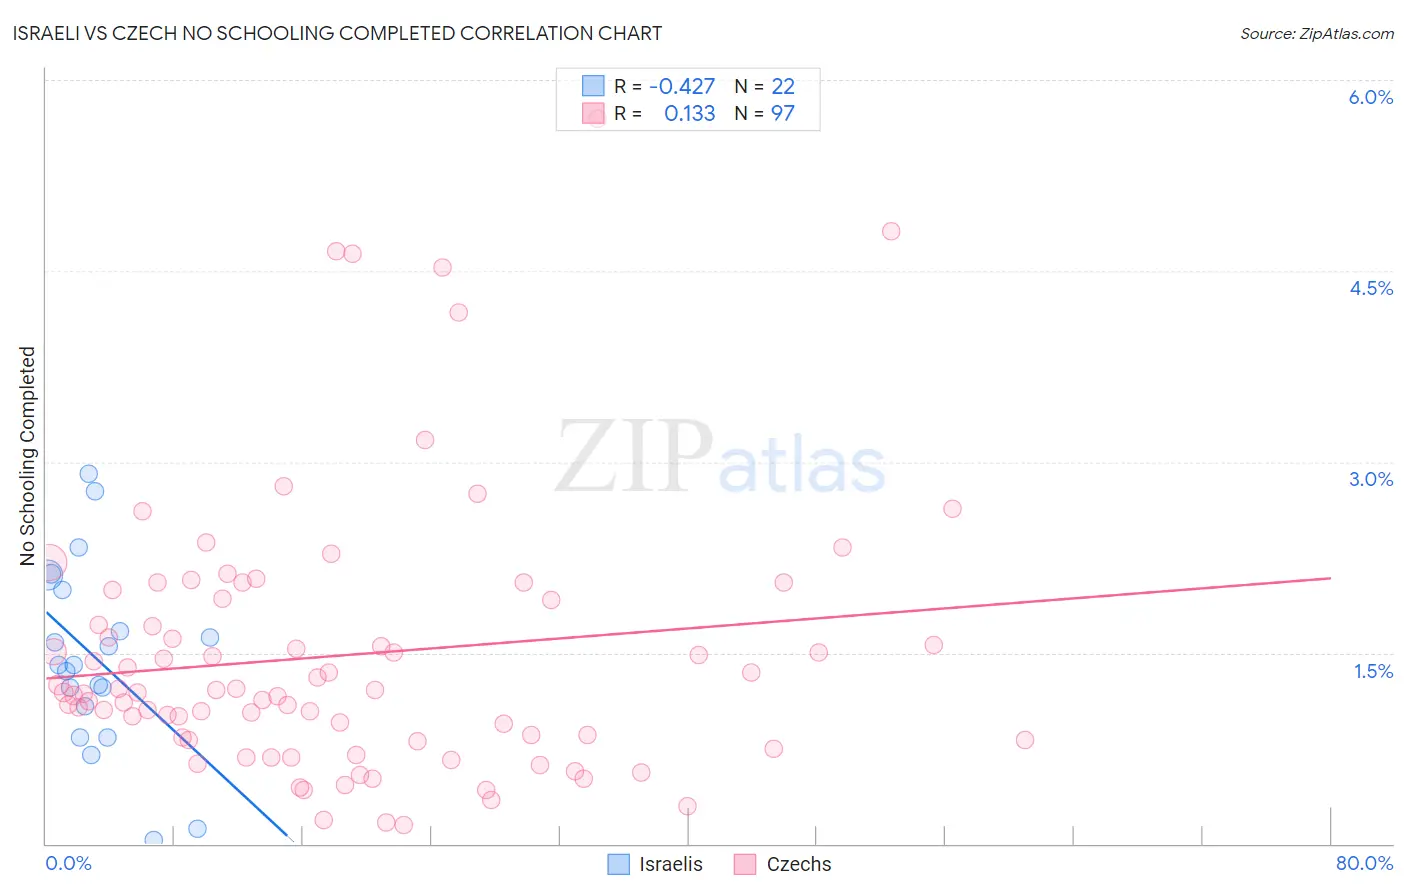
Israeli vs Czech No Schooling Completed Correlation Chart
The statistical analysis conducted on geographies consisting of 209,814,724 people shows a moderate negative correlation between the proportion of Israelis and percentage of population with no schooling in the United States with a correlation coefficient (R) of -0.427 and weighted average of 1.9%. Similarly, the statistical analysis conducted on geographies consisting of 474,064,370 people shows a poor positive correlation between the proportion of Czechs and percentage of population with no schooling in the United States with a correlation coefficient (R) of 0.133 and weighted average of 1.5%, a difference of 28.3%.
No Schooling Completed Correlation Summary
| Measurement | Israeli | Czech |
| Minimum | 0.026% | 0.15% |
| Maximum | 2.9% | 5.7% |
| Range | 2.9% | 5.5% |
| Mean | 1.5% | 1.5% |
| Median | 1.4% | 1.2% |
| Interquartile 25% (IQ1) | 1.1% | 0.82% |
| Interquartile 75% (IQ3) | 2.0% | 1.9% |
| Interquartile Range (IQR) | 0.91% | 1.1% |
| Standard Deviation (Sample) | 0.73% | 1.1% |
| Standard Deviation (Population) | 0.72% | 1.1% |
Similar Demographics by No Schooling Completed
Demographics Similar to Israelis by No Schooling Completed
In terms of no schooling completed, the demographic groups most similar to Israelis are Immigrants from Romania (1.9%, a difference of 0.060%), Spaniard (1.9%, a difference of 0.090%), Seminole (1.9%, a difference of 0.23%), Palestinian (1.9%, a difference of 0.33%), and Immigrants from Hungary (1.9%, a difference of 0.44%).
| Demographics | Rating | Rank | No Schooling Completed |
| Immigrants | Bulgaria | 94.6 /100 | #120 | Exceptional 1.9% |
| Immigrants | Croatia | 94.5 /100 | #121 | Exceptional 1.9% |
| Cree | 94.5 /100 | #122 | Exceptional 1.9% |
| Immigrants | Kuwait | 93.9 /100 | #123 | Exceptional 1.9% |
| Cambodians | 93.8 /100 | #124 | Exceptional 1.9% |
| Immigrants | Europe | 93.7 /100 | #125 | Exceptional 1.9% |
| Immigrants | Romania | 92.6 /100 | #126 | Exceptional 1.9% |
| Israelis | 92.4 /100 | #127 | Exceptional 1.9% |
| Spaniards | 92.3 /100 | #128 | Exceptional 1.9% |
| Seminole | 92.0 /100 | #129 | Exceptional 1.9% |
| Palestinians | 91.8 /100 | #130 | Exceptional 1.9% |
| Immigrants | Hungary | 91.6 /100 | #131 | Exceptional 1.9% |
| Colville | 90.4 /100 | #132 | Exceptional 1.9% |
| Immigrants | Turkey | 90.2 /100 | #133 | Exceptional 1.9% |
| Menominee | 89.6 /100 | #134 | Excellent 1.9% |
Demographics Similar to Czechs by No Schooling Completed
In terms of no schooling completed, the demographic groups most similar to Czechs are Scandinavian (1.5%, a difference of 0.53%), French Canadian (1.5%, a difference of 0.54%), French (1.5%, a difference of 0.59%), Pennsylvania German (1.5%, a difference of 0.61%), and European (1.5%, a difference of 0.96%).
| Demographics | Rating | Rank | No Schooling Completed |
| Alaskan Athabascans | 100.0 /100 | #19 | Exceptional 1.5% |
| Welsh | 100.0 /100 | #20 | Exceptional 1.5% |
| Chinese | 100.0 /100 | #21 | Exceptional 1.5% |
| Alaska Natives | 100.0 /100 | #22 | Exceptional 1.5% |
| Europeans | 100.0 /100 | #23 | Exceptional 1.5% |
| Pennsylvania Germans | 100.0 /100 | #24 | Exceptional 1.5% |
| French | 100.0 /100 | #25 | Exceptional 1.5% |
| Czechs | 100.0 /100 | #26 | Exceptional 1.5% |
| Scandinavians | 100.0 /100 | #27 | Exceptional 1.5% |
| French Canadians | 100.0 /100 | #28 | Exceptional 1.5% |
| Lumbee | 100.0 /100 | #29 | Exceptional 1.5% |
| British | 100.0 /100 | #30 | Exceptional 1.5% |
| Inupiat | 100.0 /100 | #31 | Exceptional 1.5% |
| Swiss | 100.0 /100 | #32 | Exceptional 1.5% |
| Italians | 100.0 /100 | #33 | Exceptional 1.5% |