Israeli vs Iranian No Schooling Completed
COMPARE
Israeli
Iranian
No Schooling Completed
No Schooling Completed Comparison
Israelis
Iranians
1.9%
NO SCHOOLING COMPLETED
92.4/ 100
METRIC RATING
127th/ 347
METRIC RANK
1.8%
NO SCHOOLING COMPLETED
98.2/ 100
METRIC RATING
98th/ 347
METRIC RANK
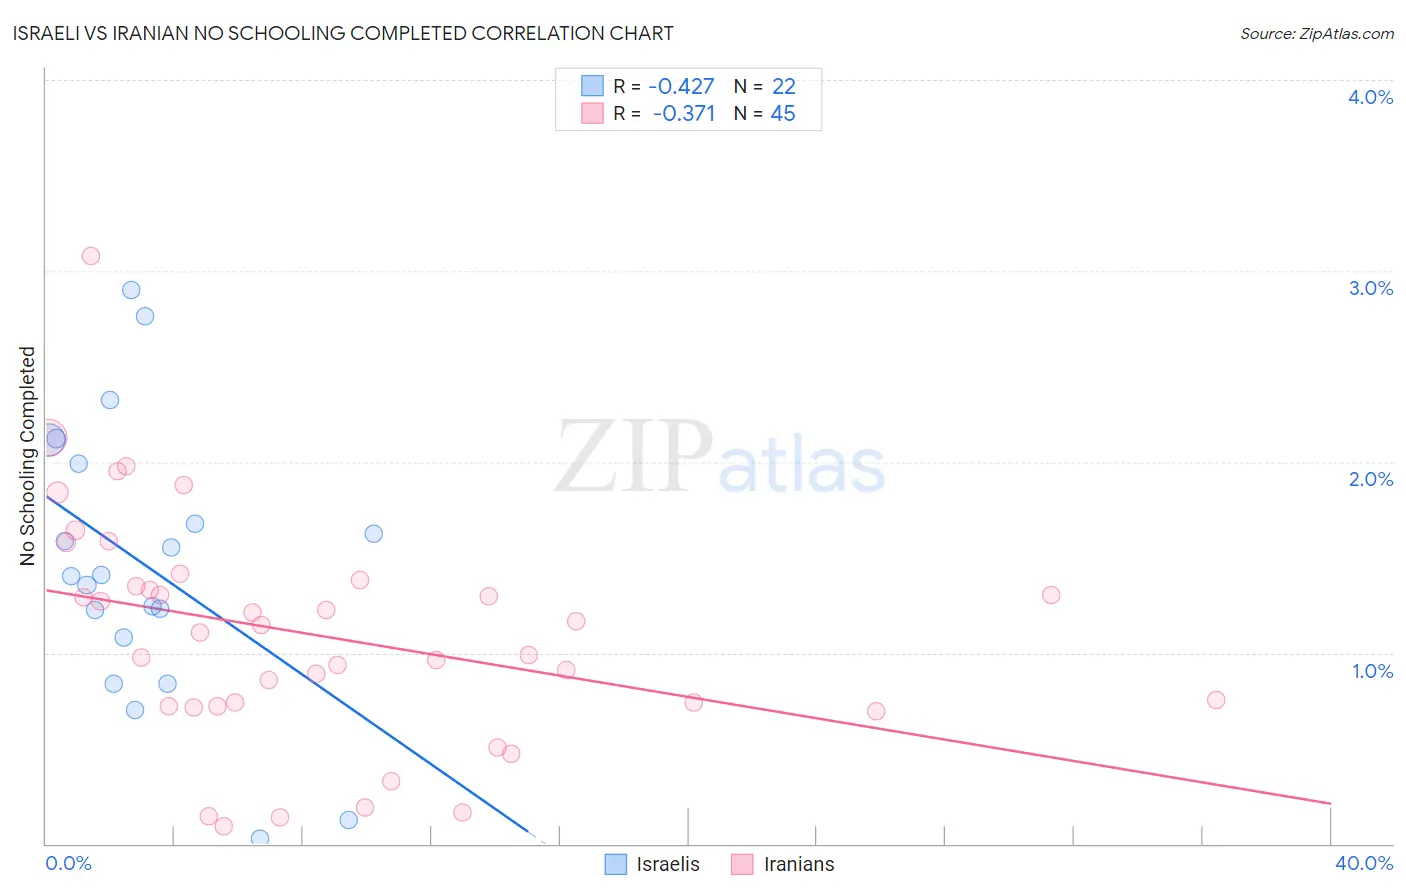
Israeli vs Iranian No Schooling Completed Correlation Chart
The statistical analysis conducted on geographies consisting of 209,814,724 people shows a moderate negative correlation between the proportion of Israelis and percentage of population with no schooling in the United States with a correlation coefficient (R) of -0.427 and weighted average of 1.9%. Similarly, the statistical analysis conducted on geographies consisting of 314,406,519 people shows a mild negative correlation between the proportion of Iranians and percentage of population with no schooling in the United States with a correlation coefficient (R) of -0.371 and weighted average of 1.8%, a difference of 5.9%.
No Schooling Completed Correlation Summary
| Measurement | Israeli | Iranian |
| Minimum | 0.026% | 0.093% |
| Maximum | 2.9% | 3.1% |
| Range | 2.9% | 3.0% |
| Mean | 1.5% | 1.1% |
| Median | 1.4% | 1.1% |
| Interquartile 25% (IQ1) | 1.1% | 0.72% |
| Interquartile 75% (IQ3) | 2.0% | 1.4% |
| Interquartile Range (IQR) | 0.91% | 0.65% |
| Standard Deviation (Sample) | 0.73% | 0.60% |
| Standard Deviation (Population) | 0.72% | 0.60% |
Similar Demographics by No Schooling Completed
Demographics Similar to Israelis by No Schooling Completed
In terms of no schooling completed, the demographic groups most similar to Israelis are Immigrants from Romania (1.9%, a difference of 0.060%), Spaniard (1.9%, a difference of 0.090%), Seminole (1.9%, a difference of 0.23%), Palestinian (1.9%, a difference of 0.33%), and Immigrants from Hungary (1.9%, a difference of 0.44%).
| Demographics | Rating | Rank | No Schooling Completed |
| Immigrants | Bulgaria | 94.6 /100 | #120 | Exceptional 1.9% |
| Immigrants | Croatia | 94.5 /100 | #121 | Exceptional 1.9% |
| Cree | 94.5 /100 | #122 | Exceptional 1.9% |
| Immigrants | Kuwait | 93.9 /100 | #123 | Exceptional 1.9% |
| Cambodians | 93.8 /100 | #124 | Exceptional 1.9% |
| Immigrants | Europe | 93.7 /100 | #125 | Exceptional 1.9% |
| Immigrants | Romania | 92.6 /100 | #126 | Exceptional 1.9% |
| Israelis | 92.4 /100 | #127 | Exceptional 1.9% |
| Spaniards | 92.3 /100 | #128 | Exceptional 1.9% |
| Seminole | 92.0 /100 | #129 | Exceptional 1.9% |
| Palestinians | 91.8 /100 | #130 | Exceptional 1.9% |
| Immigrants | Hungary | 91.6 /100 | #131 | Exceptional 1.9% |
| Colville | 90.4 /100 | #132 | Exceptional 1.9% |
| Immigrants | Turkey | 90.2 /100 | #133 | Exceptional 1.9% |
| Menominee | 89.6 /100 | #134 | Excellent 1.9% |
Demographics Similar to Iranians by No Schooling Completed
In terms of no schooling completed, the demographic groups most similar to Iranians are Choctaw (1.8%, a difference of 0.19%), Immigrants from Ireland (1.8%, a difference of 0.28%), Immigrants from Singapore (1.8%, a difference of 0.39%), Bhutanese (1.8%, a difference of 0.46%), and Immigrants from Czechoslovakia (1.8%, a difference of 0.68%).
| Demographics | Rating | Rank | No Schooling Completed |
| Immigrants | Germany | 99.0 /100 | #91 | Exceptional 1.8% |
| Romanians | 98.8 /100 | #92 | Exceptional 1.8% |
| Turks | 98.7 /100 | #93 | Exceptional 1.8% |
| Immigrants | Nonimmigrants | 98.5 /100 | #94 | Exceptional 1.8% |
| Puget Sound Salish | 98.5 /100 | #95 | Exceptional 1.8% |
| Bhutanese | 98.4 /100 | #96 | Exceptional 1.8% |
| Immigrants | Ireland | 98.4 /100 | #97 | Exceptional 1.8% |
| Iranians | 98.2 /100 | #98 | Exceptional 1.8% |
| Choctaw | 98.1 /100 | #99 | Exceptional 1.8% |
| Immigrants | Singapore | 98.0 /100 | #100 | Exceptional 1.8% |
| Immigrants | Czechoslovakia | 97.9 /100 | #101 | Exceptional 1.8% |
| Immigrants | Switzerland | 97.9 /100 | #102 | Exceptional 1.8% |
| Basques | 97.9 /100 | #103 | Exceptional 1.8% |
| Thais | 97.5 /100 | #104 | Exceptional 1.8% |
| German Russians | 97.5 /100 | #105 | Exceptional 1.8% |