Sri Lankan vs Czech No Schooling Completed
COMPARE
Sri Lankan
Czech
No Schooling Completed
No Schooling Completed Comparison
Sri Lankans
Czechs
3.0%
NO SCHOOLING COMPLETED
0.0/ 100
METRIC RATING
312th/ 347
METRIC RANK
1.5%
NO SCHOOLING COMPLETED
100.0/ 100
METRIC RATING
26th/ 347
METRIC RANK
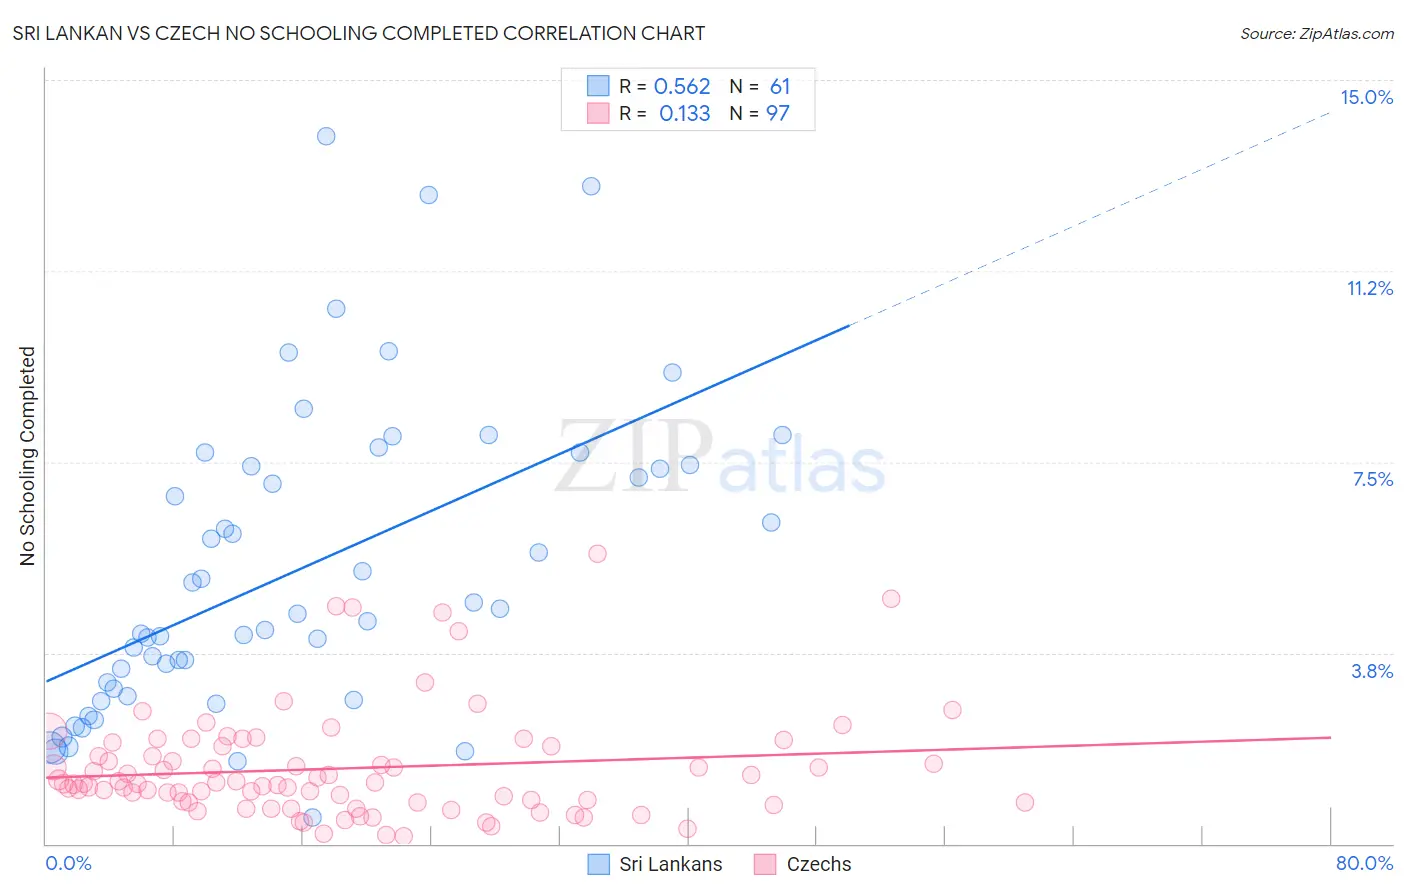
Sri Lankan vs Czech No Schooling Completed Correlation Chart
The statistical analysis conducted on geographies consisting of 436,055,968 people shows a substantial positive correlation between the proportion of Sri Lankans and percentage of population with no schooling in the United States with a correlation coefficient (R) of 0.562 and weighted average of 3.0%. Similarly, the statistical analysis conducted on geographies consisting of 474,064,370 people shows a poor positive correlation between the proportion of Czechs and percentage of population with no schooling in the United States with a correlation coefficient (R) of 0.133 and weighted average of 1.5%, a difference of 104.3%.
No Schooling Completed Correlation Summary
| Measurement | Sri Lankan | Czech |
| Minimum | 0.51% | 0.15% |
| Maximum | 13.9% | 5.7% |
| Range | 13.4% | 5.5% |
| Mean | 5.4% | 1.5% |
| Median | 4.5% | 1.2% |
| Interquartile 25% (IQ1) | 3.0% | 0.82% |
| Interquartile 75% (IQ3) | 7.4% | 1.9% |
| Interquartile Range (IQR) | 4.5% | 1.1% |
| Standard Deviation (Sample) | 3.0% | 1.1% |
| Standard Deviation (Population) | 3.0% | 1.1% |
Similar Demographics by No Schooling Completed
Demographics Similar to Sri Lankans by No Schooling Completed
In terms of no schooling completed, the demographic groups most similar to Sri Lankans are Immigrants from the Azores (3.0%, a difference of 0.28%), Guyanese (3.0%, a difference of 0.38%), Hispanic or Latino (3.0%, a difference of 0.43%), Honduran (3.1%, a difference of 0.51%), and Immigrants from Belize (3.1%, a difference of 0.60%).
| Demographics | Rating | Rank | No Schooling Completed |
| Ecuadorians | 0.0 /100 | #305 | Tragic 3.0% |
| Belizeans | 0.0 /100 | #306 | Tragic 3.0% |
| Immigrants | Haiti | 0.0 /100 | #307 | Tragic 3.0% |
| Immigrants | Somalia | 0.0 /100 | #308 | Tragic 3.0% |
| Hispanics or Latinos | 0.0 /100 | #309 | Tragic 3.0% |
| Guyanese | 0.0 /100 | #310 | Tragic 3.0% |
| Immigrants | Azores | 0.0 /100 | #311 | Tragic 3.0% |
| Sri Lankans | 0.0 /100 | #312 | Tragic 3.0% |
| Hondurans | 0.0 /100 | #313 | Tragic 3.1% |
| Immigrants | Belize | 0.0 /100 | #314 | Tragic 3.1% |
| Immigrants | Nicaragua | 0.0 /100 | #315 | Tragic 3.1% |
| Immigrants | Ecuador | 0.0 /100 | #316 | Tragic 3.1% |
| Cape Verdeans | 0.0 /100 | #317 | Tragic 3.1% |
| Immigrants | Guyana | 0.0 /100 | #318 | Tragic 3.1% |
| Immigrants | Burma/Myanmar | 0.0 /100 | #319 | Tragic 3.1% |
Demographics Similar to Czechs by No Schooling Completed
In terms of no schooling completed, the demographic groups most similar to Czechs are Scandinavian (1.5%, a difference of 0.53%), French Canadian (1.5%, a difference of 0.54%), French (1.5%, a difference of 0.59%), Pennsylvania German (1.5%, a difference of 0.61%), and European (1.5%, a difference of 0.96%).
| Demographics | Rating | Rank | No Schooling Completed |
| Alaskan Athabascans | 100.0 /100 | #19 | Exceptional 1.5% |
| Welsh | 100.0 /100 | #20 | Exceptional 1.5% |
| Chinese | 100.0 /100 | #21 | Exceptional 1.5% |
| Alaska Natives | 100.0 /100 | #22 | Exceptional 1.5% |
| Europeans | 100.0 /100 | #23 | Exceptional 1.5% |
| Pennsylvania Germans | 100.0 /100 | #24 | Exceptional 1.5% |
| French | 100.0 /100 | #25 | Exceptional 1.5% |
| Czechs | 100.0 /100 | #26 | Exceptional 1.5% |
| Scandinavians | 100.0 /100 | #27 | Exceptional 1.5% |
| French Canadians | 100.0 /100 | #28 | Exceptional 1.5% |
| Lumbee | 100.0 /100 | #29 | Exceptional 1.5% |
| British | 100.0 /100 | #30 | Exceptional 1.5% |
| Inupiat | 100.0 /100 | #31 | Exceptional 1.5% |
| Swiss | 100.0 /100 | #32 | Exceptional 1.5% |
| Italians | 100.0 /100 | #33 | Exceptional 1.5% |