Israeli vs Ottawa No Schooling Completed
COMPARE
Israeli
Ottawa
No Schooling Completed
No Schooling Completed Comparison
Israelis
Ottawa
1.9%
NO SCHOOLING COMPLETED
92.4/ 100
METRIC RATING
127th/ 347
METRIC RANK
1.6%
NO SCHOOLING COMPLETED
99.9/ 100
METRIC RATING
47th/ 347
METRIC RANK
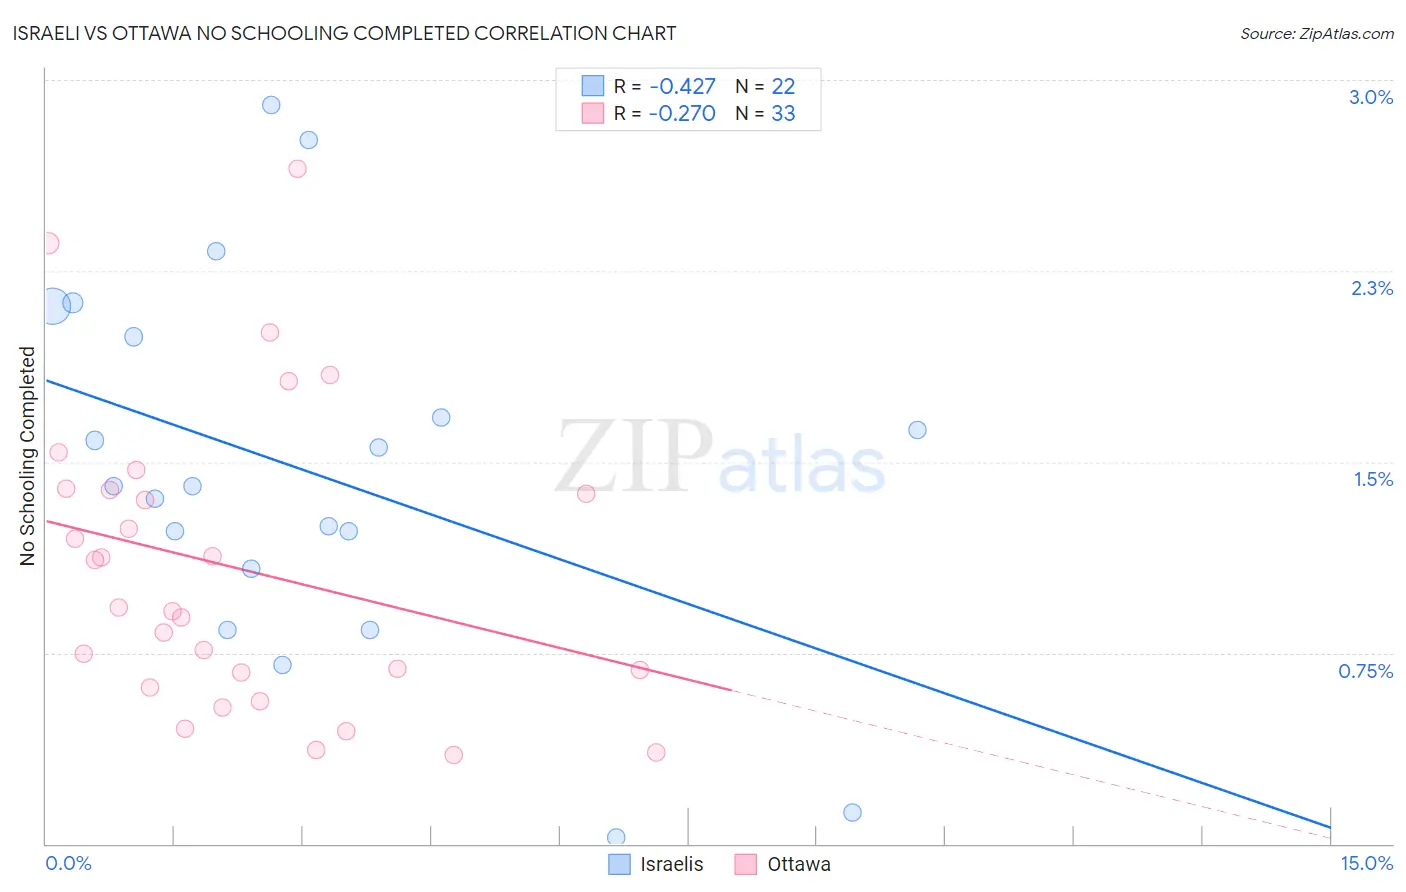
Israeli vs Ottawa No Schooling Completed Correlation Chart
The statistical analysis conducted on geographies consisting of 209,814,724 people shows a moderate negative correlation between the proportion of Israelis and percentage of population with no schooling in the United States with a correlation coefficient (R) of -0.427 and weighted average of 1.9%. Similarly, the statistical analysis conducted on geographies consisting of 49,739,017 people shows a weak negative correlation between the proportion of Ottawa and percentage of population with no schooling in the United States with a correlation coefficient (R) of -0.270 and weighted average of 1.6%, a difference of 17.8%.
No Schooling Completed Correlation Summary
| Measurement | Israeli | Ottawa |
| Minimum | 0.026% | 0.35% |
| Maximum | 2.9% | 2.6% |
| Range | 2.9% | 2.3% |
| Mean | 1.5% | 1.1% |
| Median | 1.4% | 0.93% |
| Interquartile 25% (IQ1) | 1.1% | 0.64% |
| Interquartile 75% (IQ3) | 2.0% | 1.4% |
| Interquartile Range (IQR) | 0.91% | 0.75% |
| Standard Deviation (Sample) | 0.73% | 0.58% |
| Standard Deviation (Population) | 0.72% | 0.57% |
Similar Demographics by No Schooling Completed
Demographics Similar to Israelis by No Schooling Completed
In terms of no schooling completed, the demographic groups most similar to Israelis are Immigrants from Romania (1.9%, a difference of 0.060%), Spaniard (1.9%, a difference of 0.090%), Seminole (1.9%, a difference of 0.23%), Palestinian (1.9%, a difference of 0.33%), and Immigrants from Hungary (1.9%, a difference of 0.44%).
| Demographics | Rating | Rank | No Schooling Completed |
| Immigrants | Bulgaria | 94.6 /100 | #120 | Exceptional 1.9% |
| Immigrants | Croatia | 94.5 /100 | #121 | Exceptional 1.9% |
| Cree | 94.5 /100 | #122 | Exceptional 1.9% |
| Immigrants | Kuwait | 93.9 /100 | #123 | Exceptional 1.9% |
| Cambodians | 93.8 /100 | #124 | Exceptional 1.9% |
| Immigrants | Europe | 93.7 /100 | #125 | Exceptional 1.9% |
| Immigrants | Romania | 92.6 /100 | #126 | Exceptional 1.9% |
| Israelis | 92.4 /100 | #127 | Exceptional 1.9% |
| Spaniards | 92.3 /100 | #128 | Exceptional 1.9% |
| Seminole | 92.0 /100 | #129 | Exceptional 1.9% |
| Palestinians | 91.8 /100 | #130 | Exceptional 1.9% |
| Immigrants | Hungary | 91.6 /100 | #131 | Exceptional 1.9% |
| Colville | 90.4 /100 | #132 | Exceptional 1.9% |
| Immigrants | Turkey | 90.2 /100 | #133 | Exceptional 1.9% |
| Menominee | 89.6 /100 | #134 | Excellent 1.9% |
Demographics Similar to Ottawa by No Schooling Completed
In terms of no schooling completed, the demographic groups most similar to Ottawa are Maltese (1.6%, a difference of 0.14%), Czechoslovakian (1.6%, a difference of 0.24%), Immigrants from Scotland (1.6%, a difference of 0.26%), Estonian (1.6%, a difference of 0.27%), and White/Caucasian (1.6%, a difference of 0.31%).
| Demographics | Rating | Rank | No Schooling Completed |
| Luxembourgers | 99.9 /100 | #40 | Exceptional 1.6% |
| Hungarians | 99.9 /100 | #41 | Exceptional 1.6% |
| Bulgarians | 99.9 /100 | #42 | Exceptional 1.6% |
| Australians | 99.9 /100 | #43 | Exceptional 1.6% |
| Estonians | 99.9 /100 | #44 | Exceptional 1.6% |
| Czechoslovakians | 99.9 /100 | #45 | Exceptional 1.6% |
| Maltese | 99.9 /100 | #46 | Exceptional 1.6% |
| Ottawa | 99.9 /100 | #47 | Exceptional 1.6% |
| Immigrants | Scotland | 99.9 /100 | #48 | Exceptional 1.6% |
| Whites/Caucasians | 99.9 /100 | #49 | Exceptional 1.6% |
| Celtics | 99.9 /100 | #50 | Exceptional 1.6% |
| Chippewa | 99.8 /100 | #51 | Exceptional 1.6% |
| Immigrants | Canada | 99.8 /100 | #52 | Exceptional 1.6% |
| Creek | 99.8 /100 | #53 | Exceptional 1.6% |
| Crow | 99.8 /100 | #54 | Exceptional 1.6% |