Israeli vs Czech Unemployment Among Women with Children Under 18 years
COMPARE
Israeli
Czech
Unemployment Among Women with Children Under 18 years
Unemployment Among Women with Children Under 18 years Comparison
Israelis
Czechs
5.6%
UNEMPLOYMENT AMONG WOMEN WITH CHILDREN UNDER 18 YEARS
15.6/ 100
METRIC RATING
204th/ 347
METRIC RANK
4.7%
UNEMPLOYMENT AMONG WOMEN WITH CHILDREN UNDER 18 YEARS
99.9/ 100
METRIC RATING
10th/ 347
METRIC RANK
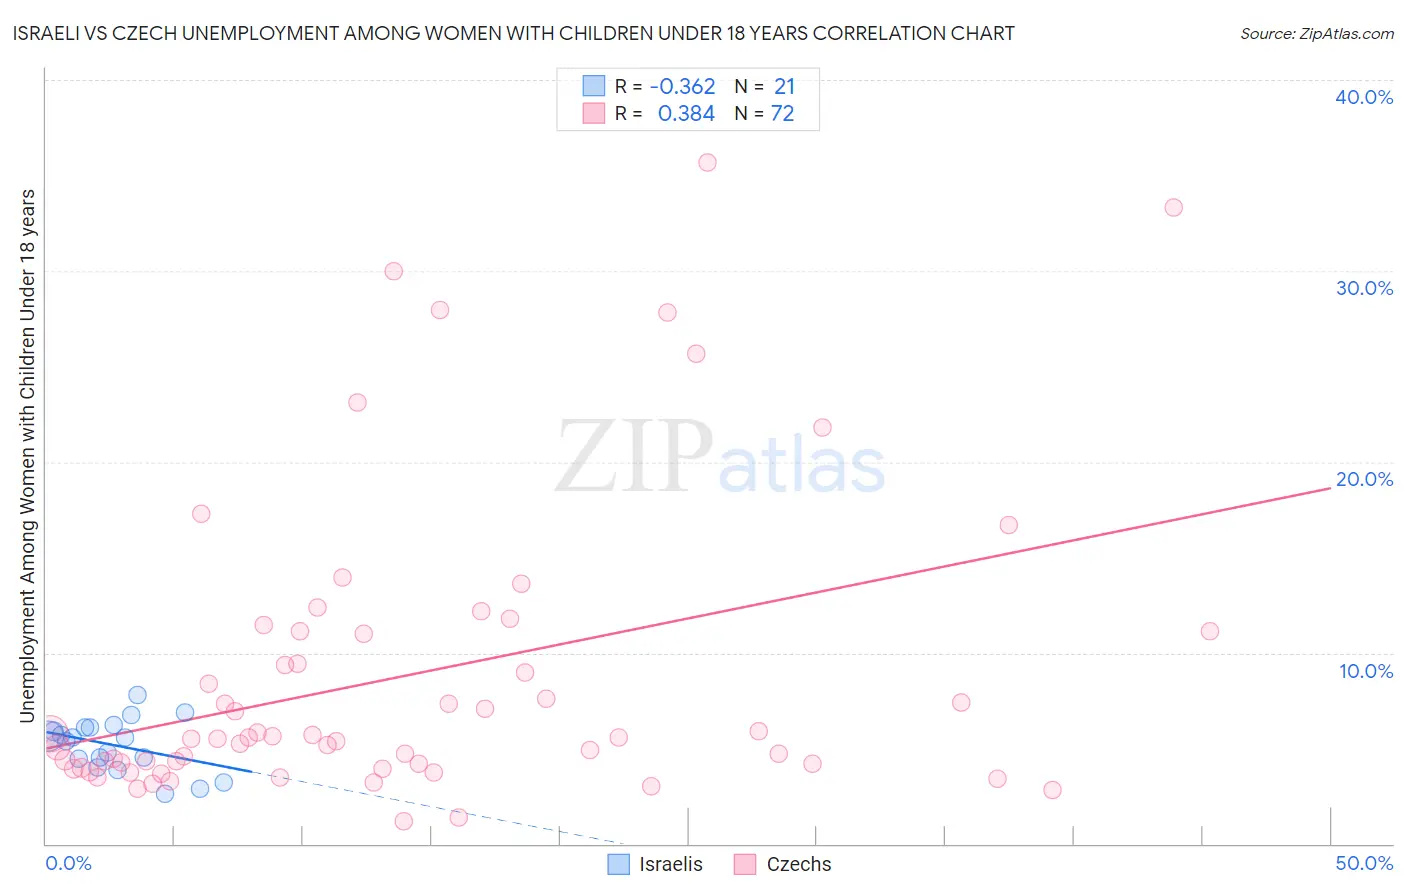
Israeli vs Czech Unemployment Among Women with Children Under 18 years Correlation Chart
The statistical analysis conducted on geographies consisting of 206,692,702 people shows a mild negative correlation between the proportion of Israelis and unemployment rate among women with children under the age of 18 in the United States with a correlation coefficient (R) of -0.362 and weighted average of 5.6%. Similarly, the statistical analysis conducted on geographies consisting of 450,308,902 people shows a mild positive correlation between the proportion of Czechs and unemployment rate among women with children under the age of 18 in the United States with a correlation coefficient (R) of 0.384 and weighted average of 4.7%, a difference of 18.6%.
Unemployment Among Women with Children Under 18 years Correlation Summary
| Measurement | Israeli | Czech |
| Minimum | 2.6% | 1.2% |
| Maximum | 7.8% | 35.7% |
| Range | 5.2% | 34.5% |
| Mean | 5.2% | 8.8% |
| Median | 5.5% | 5.5% |
| Interquartile 25% (IQ1) | 4.2% | 4.1% |
| Interquartile 75% (IQ3) | 6.1% | 11.0% |
| Interquartile Range (IQR) | 1.8% | 7.0% |
| Standard Deviation (Sample) | 1.4% | 7.8% |
| Standard Deviation (Population) | 1.3% | 7.8% |
Similar Demographics by Unemployment Among Women with Children Under 18 years
Demographics Similar to Israelis by Unemployment Among Women with Children Under 18 years
In terms of unemployment among women with children under 18 years, the demographic groups most similar to Israelis are Portuguese (5.6%, a difference of 0.030%), Tsimshian (5.6%, a difference of 0.050%), Immigrants from Micronesia (5.6%, a difference of 0.18%), Immigrants from Morocco (5.6%, a difference of 0.27%), and Menominee (5.6%, a difference of 0.36%).
| Demographics | Rating | Rank | Unemployment Among Women with Children Under 18 years |
| Immigrants | Colombia | 21.4 /100 | #197 | Fair 5.6% |
| Arabs | 21.4 /100 | #198 | Fair 5.6% |
| Marshallese | 20.2 /100 | #199 | Fair 5.6% |
| Menominee | 18.6 /100 | #200 | Poor 5.6% |
| Immigrants | Morocco | 17.9 /100 | #201 | Poor 5.6% |
| Immigrants | Micronesia | 17.1 /100 | #202 | Poor 5.6% |
| Portuguese | 15.9 /100 | #203 | Poor 5.6% |
| Israelis | 15.6 /100 | #204 | Poor 5.6% |
| Tsimshian | 15.2 /100 | #205 | Poor 5.6% |
| Nicaraguans | 12.3 /100 | #206 | Poor 5.6% |
| Peruvians | 12.1 /100 | #207 | Poor 5.6% |
| Immigrants | Costa Rica | 11.6 /100 | #208 | Poor 5.6% |
| Immigrants | Western Asia | 11.3 /100 | #209 | Poor 5.6% |
| Immigrants | Nonimmigrants | 10.6 /100 | #210 | Poor 5.7% |
| Panamanians | 10.1 /100 | #211 | Poor 5.7% |
Demographics Similar to Czechs by Unemployment Among Women with Children Under 18 years
In terms of unemployment among women with children under 18 years, the demographic groups most similar to Czechs are Okinawan (4.7%, a difference of 0.010%), Filipino (4.8%, a difference of 0.45%), Immigrants from Hong Kong (4.7%, a difference of 0.85%), Scandinavian (4.8%, a difference of 0.91%), and Immigrants from India (4.7%, a difference of 1.3%).
| Demographics | Rating | Rank | Unemployment Among Women with Children Under 18 years |
| Danes | 100.0 /100 | #3 | Exceptional 4.5% |
| Swedes | 100.0 /100 | #4 | Exceptional 4.7% |
| Tongans | 100.0 /100 | #5 | Exceptional 4.7% |
| Immigrants | Taiwan | 100.0 /100 | #6 | Exceptional 4.7% |
| Immigrants | India | 100.0 /100 | #7 | Exceptional 4.7% |
| Immigrants | Hong Kong | 100.0 /100 | #8 | Exceptional 4.7% |
| Okinawans | 99.9 /100 | #9 | Exceptional 4.7% |
| Czechs | 99.9 /100 | #10 | Exceptional 4.7% |
| Filipinos | 99.9 /100 | #11 | Exceptional 4.8% |
| Scandinavians | 99.9 /100 | #12 | Exceptional 4.8% |
| Bulgarians | 99.9 /100 | #13 | Exceptional 4.8% |
| Cambodians | 99.9 /100 | #14 | Exceptional 4.8% |
| Thais | 99.8 /100 | #15 | Exceptional 4.8% |
| Taiwanese | 99.8 /100 | #16 | Exceptional 4.8% |
| Immigrants | Singapore | 99.8 /100 | #17 | Exceptional 4.9% |