Immigrants from Chile vs Czech No Schooling Completed
COMPARE
Immigrants from Chile
Czech
No Schooling Completed
No Schooling Completed Comparison
Immigrants from Chile
Czechs
2.2%
NO SCHOOLING COMPLETED
22.7/ 100
METRIC RATING
198th/ 347
METRIC RANK
1.5%
NO SCHOOLING COMPLETED
100.0/ 100
METRIC RATING
26th/ 347
METRIC RANK
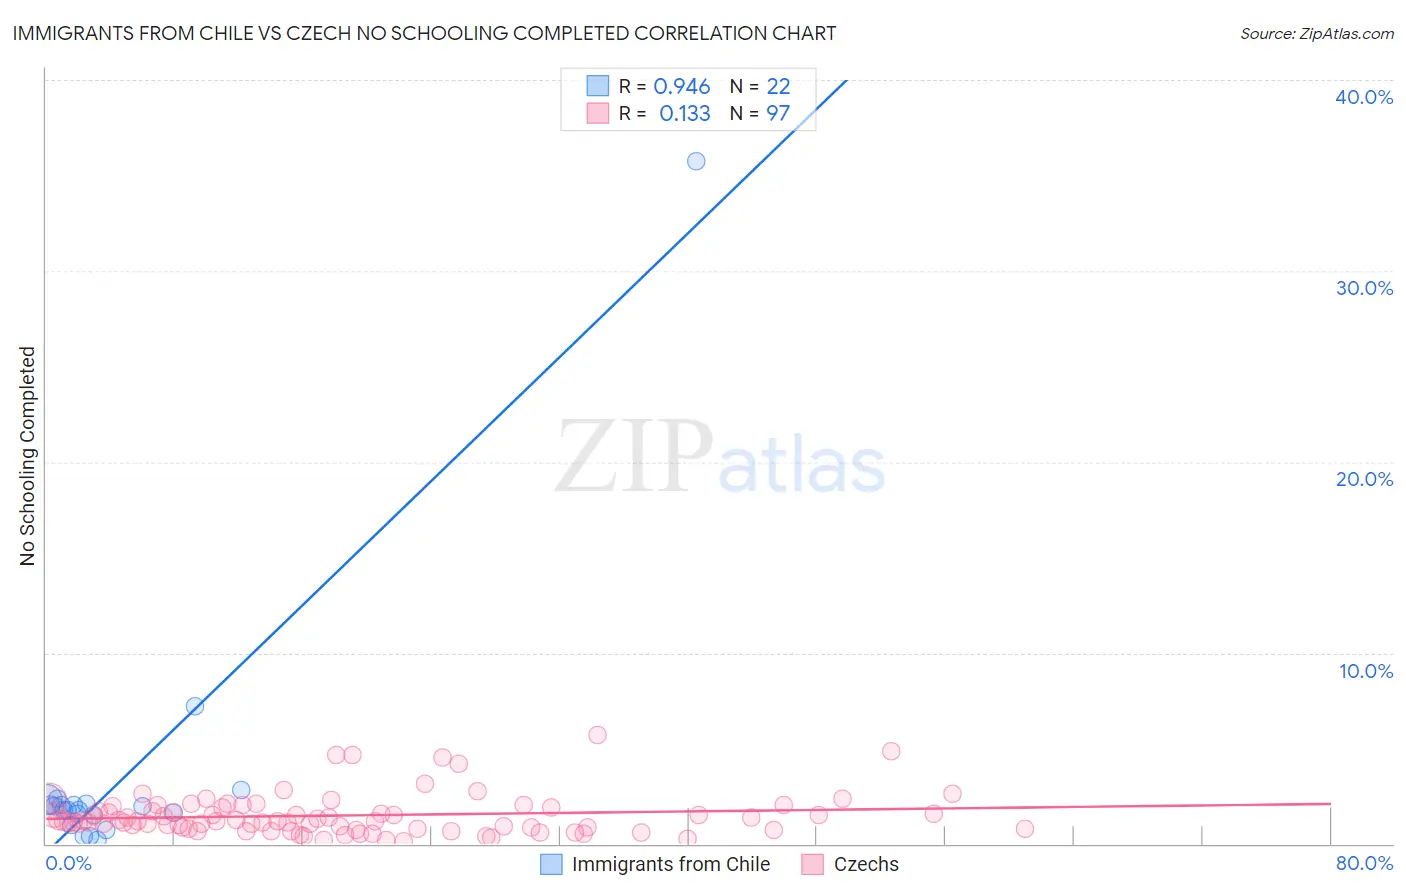
Immigrants from Chile vs Czech No Schooling Completed Correlation Chart
The statistical analysis conducted on geographies consisting of 217,752,126 people shows a near-perfect positive correlation between the proportion of Immigrants from Chile and percentage of population with no schooling in the United States with a correlation coefficient (R) of 0.946 and weighted average of 2.2%. Similarly, the statistical analysis conducted on geographies consisting of 474,064,370 people shows a poor positive correlation between the proportion of Czechs and percentage of population with no schooling in the United States with a correlation coefficient (R) of 0.133 and weighted average of 1.5%, a difference of 45.9%.
No Schooling Completed Correlation Summary
| Measurement | Immigrants from Chile | Czech |
| Minimum | 0.21% | 0.15% |
| Maximum | 35.7% | 5.7% |
| Range | 35.5% | 5.5% |
| Mean | 3.4% | 1.5% |
| Median | 1.9% | 1.2% |
| Interquartile 25% (IQ1) | 1.5% | 0.82% |
| Interquartile 75% (IQ3) | 2.1% | 1.9% |
| Interquartile Range (IQR) | 0.53% | 1.1% |
| Standard Deviation (Sample) | 7.3% | 1.1% |
| Standard Deviation (Population) | 7.2% | 1.1% |
Similar Demographics by No Schooling Completed
Demographics Similar to Immigrants from Chile by No Schooling Completed
In terms of no schooling completed, the demographic groups most similar to Immigrants from Chile are African (2.2%, a difference of 0.17%), Immigrants from Southern Europe (2.2%, a difference of 0.18%), Immigrants from Ukraine (2.2%, a difference of 0.60%), Immigrants from Northern Africa (2.2%, a difference of 0.64%), and Hawaiian (2.2%, a difference of 0.75%).
| Demographics | Rating | Rank | No Schooling Completed |
| Bermudans | 30.7 /100 | #191 | Fair 2.1% |
| Guamanians/Chamorros | 29.8 /100 | #192 | Fair 2.2% |
| Paraguayans | 29.3 /100 | #193 | Fair 2.2% |
| Immigrants | Albania | 28.3 /100 | #194 | Fair 2.2% |
| Hawaiians | 27.0 /100 | #195 | Fair 2.2% |
| Immigrants | Ukraine | 26.1 /100 | #196 | Fair 2.2% |
| Immigrants | Southern Europe | 23.8 /100 | #197 | Fair 2.2% |
| Immigrants | Chile | 22.7 /100 | #198 | Fair 2.2% |
| Africans | 21.8 /100 | #199 | Fair 2.2% |
| Immigrants | Northern Africa | 19.5 /100 | #200 | Poor 2.2% |
| Costa Ricans | 17.1 /100 | #201 | Poor 2.2% |
| Moroccans | 13.7 /100 | #202 | Poor 2.2% |
| Laotians | 13.3 /100 | #203 | Poor 2.2% |
| Hopi | 12.9 /100 | #204 | Poor 2.2% |
| Immigrants | Bahamas | 11.6 /100 | #205 | Poor 2.2% |
Demographics Similar to Czechs by No Schooling Completed
In terms of no schooling completed, the demographic groups most similar to Czechs are Scandinavian (1.5%, a difference of 0.53%), French Canadian (1.5%, a difference of 0.54%), French (1.5%, a difference of 0.59%), Pennsylvania German (1.5%, a difference of 0.61%), and European (1.5%, a difference of 0.96%).
| Demographics | Rating | Rank | No Schooling Completed |
| Alaskan Athabascans | 100.0 /100 | #19 | Exceptional 1.5% |
| Welsh | 100.0 /100 | #20 | Exceptional 1.5% |
| Chinese | 100.0 /100 | #21 | Exceptional 1.5% |
| Alaska Natives | 100.0 /100 | #22 | Exceptional 1.5% |
| Europeans | 100.0 /100 | #23 | Exceptional 1.5% |
| Pennsylvania Germans | 100.0 /100 | #24 | Exceptional 1.5% |
| French | 100.0 /100 | #25 | Exceptional 1.5% |
| Czechs | 100.0 /100 | #26 | Exceptional 1.5% |
| Scandinavians | 100.0 /100 | #27 | Exceptional 1.5% |
| French Canadians | 100.0 /100 | #28 | Exceptional 1.5% |
| Lumbee | 100.0 /100 | #29 | Exceptional 1.5% |
| British | 100.0 /100 | #30 | Exceptional 1.5% |
| Inupiat | 100.0 /100 | #31 | Exceptional 1.5% |
| Swiss | 100.0 /100 | #32 | Exceptional 1.5% |
| Italians | 100.0 /100 | #33 | Exceptional 1.5% |