Immigrants from China vs Czech No Schooling Completed
COMPARE
Immigrants from China
Czech
No Schooling Completed
No Schooling Completed Comparison
Immigrants from China
Czechs
2.6%
NO SCHOOLING COMPLETED
0.1/ 100
METRIC RATING
275th/ 347
METRIC RANK
1.5%
NO SCHOOLING COMPLETED
100.0/ 100
METRIC RATING
26th/ 347
METRIC RANK
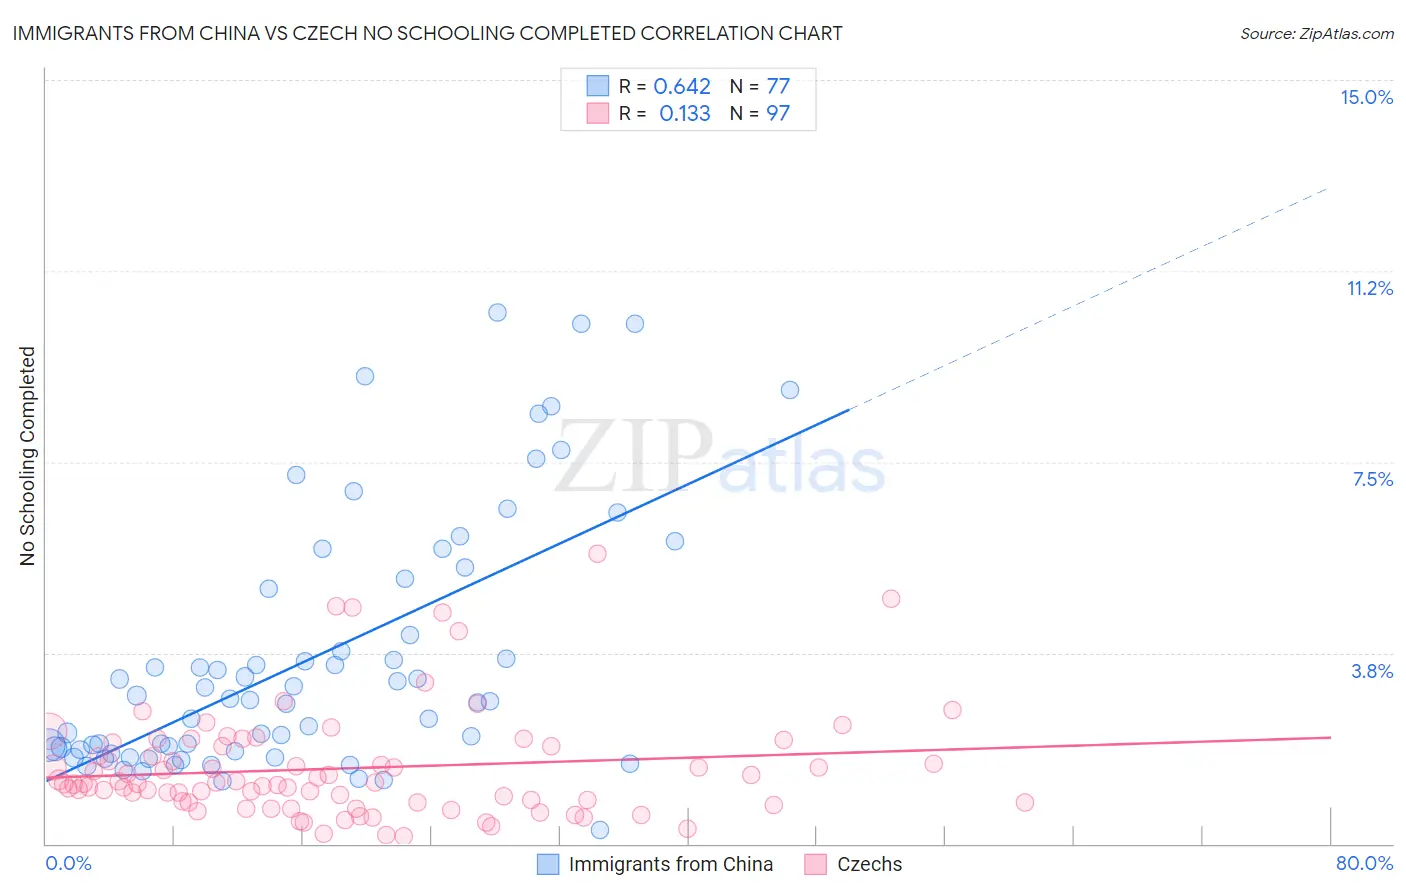
Immigrants from China vs Czech No Schooling Completed Correlation Chart
The statistical analysis conducted on geographies consisting of 450,744,905 people shows a significant positive correlation between the proportion of Immigrants from China and percentage of population with no schooling in the United States with a correlation coefficient (R) of 0.642 and weighted average of 2.6%. Similarly, the statistical analysis conducted on geographies consisting of 474,064,370 people shows a poor positive correlation between the proportion of Czechs and percentage of population with no schooling in the United States with a correlation coefficient (R) of 0.133 and weighted average of 1.5%, a difference of 71.7%.
No Schooling Completed Correlation Summary
| Measurement | Immigrants from China | Czech |
| Minimum | 0.26% | 0.15% |
| Maximum | 10.4% | 5.7% |
| Range | 10.2% | 5.5% |
| Mean | 3.6% | 1.5% |
| Median | 2.8% | 1.2% |
| Interquartile 25% (IQ1) | 1.8% | 0.82% |
| Interquartile 75% (IQ3) | 5.1% | 1.9% |
| Interquartile Range (IQR) | 3.3% | 1.1% |
| Standard Deviation (Sample) | 2.5% | 1.1% |
| Standard Deviation (Population) | 2.5% | 1.1% |
Similar Demographics by No Schooling Completed
Demographics Similar to Immigrants from China by No Schooling Completed
In terms of no schooling completed, the demographic groups most similar to Immigrants from China are Ghanaian (2.6%, a difference of 0.18%), Immigrants from Cameroon (2.5%, a difference of 0.56%), Immigrants from Western Africa (2.6%, a difference of 0.56%), Immigrants from Philippines (2.6%, a difference of 0.61%), and Immigrants from Uzbekistan (2.6%, a difference of 0.81%).
| Demographics | Rating | Rank | No Schooling Completed |
| Taiwanese | 0.3 /100 | #268 | Tragic 2.5% |
| Immigrants | Nigeria | 0.2 /100 | #269 | Tragic 2.5% |
| Immigrants | Peru | 0.2 /100 | #270 | Tragic 2.5% |
| Cubans | 0.2 /100 | #271 | Tragic 2.5% |
| Immigrants | Bolivia | 0.2 /100 | #272 | Tragic 2.5% |
| Immigrants | Cameroon | 0.1 /100 | #273 | Tragic 2.5% |
| Ghanaians | 0.1 /100 | #274 | Tragic 2.6% |
| Immigrants | China | 0.1 /100 | #275 | Tragic 2.6% |
| Immigrants | Western Africa | 0.1 /100 | #276 | Tragic 2.6% |
| Immigrants | Philippines | 0.1 /100 | #277 | Tragic 2.6% |
| Immigrants | Uzbekistan | 0.1 /100 | #278 | Tragic 2.6% |
| Barbadians | 0.1 /100 | #279 | Tragic 2.6% |
| Trinidadians and Tobagonians | 0.1 /100 | #280 | Tragic 2.6% |
| Afghans | 0.1 /100 | #281 | Tragic 2.6% |
| Immigrants | Ghana | 0.1 /100 | #282 | Tragic 2.6% |
Demographics Similar to Czechs by No Schooling Completed
In terms of no schooling completed, the demographic groups most similar to Czechs are Scandinavian (1.5%, a difference of 0.53%), French Canadian (1.5%, a difference of 0.54%), French (1.5%, a difference of 0.59%), Pennsylvania German (1.5%, a difference of 0.61%), and European (1.5%, a difference of 0.96%).
| Demographics | Rating | Rank | No Schooling Completed |
| Alaskan Athabascans | 100.0 /100 | #19 | Exceptional 1.5% |
| Welsh | 100.0 /100 | #20 | Exceptional 1.5% |
| Chinese | 100.0 /100 | #21 | Exceptional 1.5% |
| Alaska Natives | 100.0 /100 | #22 | Exceptional 1.5% |
| Europeans | 100.0 /100 | #23 | Exceptional 1.5% |
| Pennsylvania Germans | 100.0 /100 | #24 | Exceptional 1.5% |
| French | 100.0 /100 | #25 | Exceptional 1.5% |
| Czechs | 100.0 /100 | #26 | Exceptional 1.5% |
| Scandinavians | 100.0 /100 | #27 | Exceptional 1.5% |
| French Canadians | 100.0 /100 | #28 | Exceptional 1.5% |
| Lumbee | 100.0 /100 | #29 | Exceptional 1.5% |
| British | 100.0 /100 | #30 | Exceptional 1.5% |
| Inupiat | 100.0 /100 | #31 | Exceptional 1.5% |
| Swiss | 100.0 /100 | #32 | Exceptional 1.5% |
| Italians | 100.0 /100 | #33 | Exceptional 1.5% |