Iroquois vs Maltese Associate's Degree
COMPARE
Iroquois
Maltese
Associate's Degree
Associate's Degree Comparison
Iroquois
Maltese
42.8%
ASSOCIATE'S DEGREE
1.7/ 100
METRIC RATING
238th/ 347
METRIC RANK
50.4%
ASSOCIATE'S DEGREE
99.1/ 100
METRIC RATING
81st/ 347
METRIC RANK
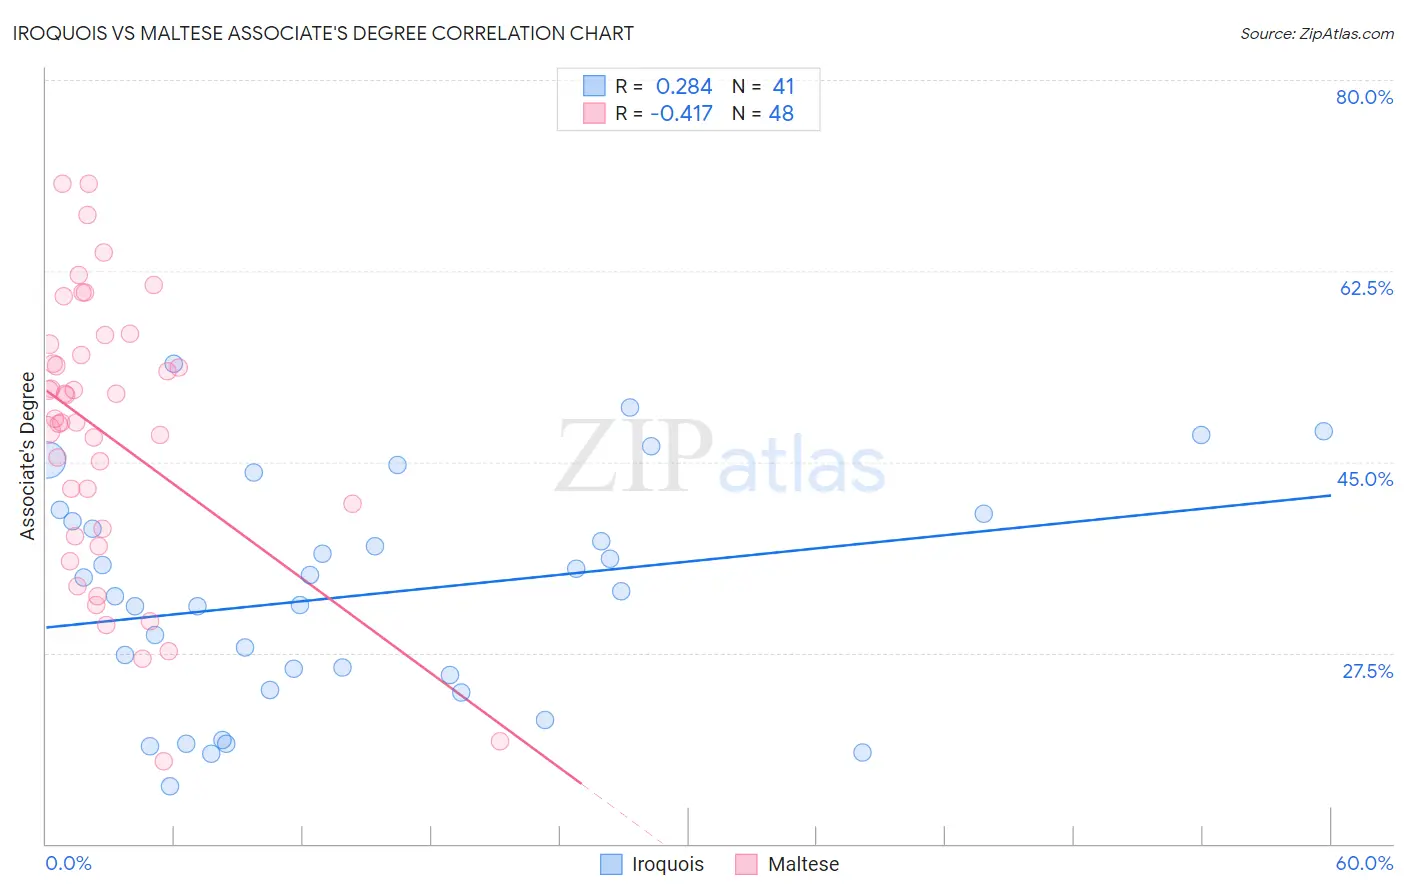
Iroquois vs Maltese Associate's Degree Correlation Chart
The statistical analysis conducted on geographies consisting of 207,308,228 people shows a weak positive correlation between the proportion of Iroquois and percentage of population with at least associate's degree education in the United States with a correlation coefficient (R) of 0.284 and weighted average of 42.8%. Similarly, the statistical analysis conducted on geographies consisting of 126,471,941 people shows a moderate negative correlation between the proportion of Maltese and percentage of population with at least associate's degree education in the United States with a correlation coefficient (R) of -0.417 and weighted average of 50.4%, a difference of 17.7%.
Associate's Degree Correlation Summary
| Measurement | Iroquois | Maltese |
| Minimum | 15.2% | 17.6% |
| Maximum | 54.0% | 70.5% |
| Range | 38.7% | 52.9% |
| Mean | 32.9% | 47.5% |
| Median | 33.2% | 48.7% |
| Interquartile 25% (IQ1) | 24.8% | 38.5% |
| Interquartile 75% (IQ3) | 39.9% | 55.3% |
| Interquartile Range (IQR) | 15.1% | 16.8% |
| Standard Deviation (Sample) | 10.1% | 12.6% |
| Standard Deviation (Population) | 9.9% | 12.5% |
Similar Demographics by Associate's Degree
Demographics Similar to Iroquois by Associate's Degree
In terms of associate's degree, the demographic groups most similar to Iroquois are Nonimmigrants (42.9%, a difference of 0.26%), Immigrants from St. Vincent and the Grenadines (42.9%, a difference of 0.28%), Ecuadorian (43.0%, a difference of 0.36%), Tlingit-Haida (43.0%, a difference of 0.45%), and Immigrants from Grenada (42.6%, a difference of 0.51%).
| Demographics | Rating | Rank | Associate's Degree |
| Liberians | 2.9 /100 | #231 | Tragic 43.3% |
| Native Hawaiians | 2.3 /100 | #232 | Tragic 43.1% |
| Tongans | 2.2 /100 | #233 | Tragic 43.0% |
| Tlingit-Haida | 2.1 /100 | #234 | Tragic 43.0% |
| Ecuadorians | 2.0 /100 | #235 | Tragic 43.0% |
| Immigrants | St. Vincent and the Grenadines | 1.9 /100 | #236 | Tragic 42.9% |
| Immigrants | Nonimmigrants | 1.9 /100 | #237 | Tragic 42.9% |
| Iroquois | 1.7 /100 | #238 | Tragic 42.8% |
| Immigrants | Grenada | 1.3 /100 | #239 | Tragic 42.6% |
| Cree | 1.2 /100 | #240 | Tragic 42.5% |
| British West Indians | 1.0 /100 | #241 | Tragic 42.4% |
| Immigrants | West Indies | 1.0 /100 | #242 | Tragic 42.4% |
| Guyanese | 1.0 /100 | #243 | Tragic 42.3% |
| Immigrants | Liberia | 0.9 /100 | #244 | Tragic 42.3% |
| Immigrants | Cambodia | 0.9 /100 | #245 | Tragic 42.3% |
Demographics Similar to Maltese by Associate's Degree
In terms of associate's degree, the demographic groups most similar to Maltese are Armenian (50.4%, a difference of 0.070%), Ethiopian (50.4%, a difference of 0.10%), Immigrants from Eastern Europe (50.5%, a difference of 0.12%), Immigrants from Lebanon (50.5%, a difference of 0.16%), and Immigrants from Zimbabwe (50.5%, a difference of 0.19%).
| Demographics | Rating | Rank | Associate's Degree |
| Lithuanians | 99.3 /100 | #74 | Exceptional 50.6% |
| Immigrants | Scotland | 99.3 /100 | #75 | Exceptional 50.6% |
| Immigrants | Zimbabwe | 99.2 /100 | #76 | Exceptional 50.5% |
| Immigrants | Lebanon | 99.1 /100 | #77 | Exceptional 50.5% |
| Immigrants | Eastern Europe | 99.1 /100 | #78 | Exceptional 50.5% |
| Ethiopians | 99.1 /100 | #79 | Exceptional 50.4% |
| Armenians | 99.1 /100 | #80 | Exceptional 50.4% |
| Maltese | 99.1 /100 | #81 | Exceptional 50.4% |
| Greeks | 98.9 /100 | #82 | Exceptional 50.3% |
| Immigrants | Uzbekistan | 98.9 /100 | #83 | Exceptional 50.3% |
| Immigrants | Hungary | 98.9 /100 | #84 | Exceptional 50.2% |
| Immigrants | Egypt | 98.9 /100 | #85 | Exceptional 50.2% |
| Immigrants | Croatia | 98.9 /100 | #86 | Exceptional 50.2% |
| Immigrants | Moldova | 98.8 /100 | #87 | Exceptional 50.2% |
| Immigrants | Canada | 98.7 /100 | #88 | Exceptional 50.1% |