Irish vs Australian Master's Degree
COMPARE
Irish
Australian
Master's Degree
Master's Degree Comparison
Irish
Australians
15.0%
MASTER'S DEGREE
56.3/ 100
METRIC RATING
170th/ 347
METRIC RANK
18.4%
MASTER'S DEGREE
99.9/ 100
METRIC RATING
58th/ 347
METRIC RANK
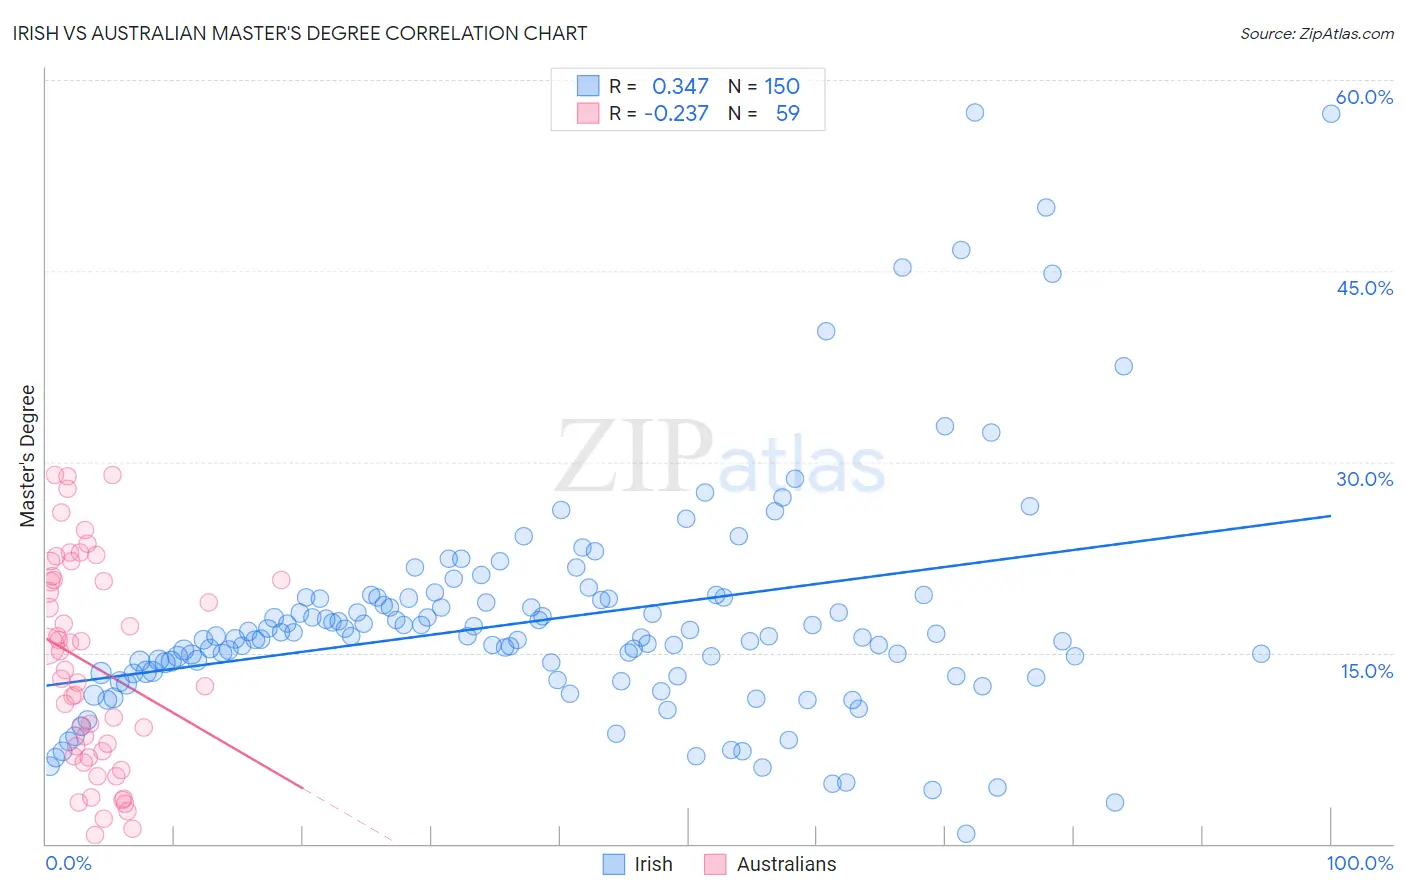
Irish vs Australian Master's Degree Correlation Chart
The statistical analysis conducted on geographies consisting of 579,087,481 people shows a mild positive correlation between the proportion of Irish and percentage of population with at least master's degree education in the United States with a correlation coefficient (R) of 0.347 and weighted average of 15.0%. Similarly, the statistical analysis conducted on geographies consisting of 224,102,387 people shows a weak negative correlation between the proportion of Australians and percentage of population with at least master's degree education in the United States with a correlation coefficient (R) of -0.237 and weighted average of 18.4%, a difference of 22.3%.
Master's Degree Correlation Summary
| Measurement | Irish | Australian |
| Minimum | 0.78% | 0.65% |
| Maximum | 57.5% | 29.0% |
| Range | 56.7% | 28.4% |
| Mean | 17.6% | 14.0% |
| Median | 16.3% | 13.7% |
| Interquartile 25% (IQ1) | 13.4% | 6.9% |
| Interquartile 75% (IQ3) | 19.3% | 20.7% |
| Interquartile Range (IQR) | 5.9% | 13.9% |
| Standard Deviation (Sample) | 9.0% | 8.1% |
| Standard Deviation (Population) | 9.0% | 8.1% |
Similar Demographics by Master's Degree
Demographics Similar to Irish by Master's Degree
In terms of master's degree, the demographic groups most similar to Irish are Immigrants from Ghana (15.0%, a difference of 0.35%), Immigrants from Uruguay (15.0%, a difference of 0.46%), Costa Rican (15.0%, a difference of 0.50%), Slovak (14.9%, a difference of 0.81%), and Scottish (15.2%, a difference of 0.84%).
| Demographics | Rating | Rank | Master's Degree |
| Uruguayans | 67.1 /100 | #163 | Good 15.3% |
| Colombians | 66.9 /100 | #164 | Good 15.3% |
| Immigrants | Kenya | 66.6 /100 | #165 | Good 15.3% |
| Swedes | 66.1 /100 | #166 | Good 15.2% |
| Senegalese | 65.6 /100 | #167 | Good 15.2% |
| Immigrants | North Macedonia | 64.5 /100 | #168 | Good 15.2% |
| Scottish | 62.7 /100 | #169 | Good 15.2% |
| Irish | 56.3 /100 | #170 | Average 15.0% |
| Immigrants | Ghana | 53.6 /100 | #171 | Average 15.0% |
| Immigrants | Uruguay | 52.8 /100 | #172 | Average 15.0% |
| Costa Ricans | 52.5 /100 | #173 | Average 15.0% |
| Slovaks | 50.0 /100 | #174 | Average 14.9% |
| Immigrants | Peru | 49.6 /100 | #175 | Average 14.9% |
| Nigerians | 48.6 /100 | #176 | Average 14.9% |
| Immigrants | Colombia | 48.3 /100 | #177 | Average 14.9% |
Demographics Similar to Australians by Master's Degree
In terms of master's degree, the demographic groups most similar to Australians are Immigrants from Asia (18.4%, a difference of 0.13%), Asian (18.4%, a difference of 0.27%), Immigrants from Bulgaria (18.3%, a difference of 0.44%), Immigrants from Serbia (18.5%, a difference of 0.49%), and Immigrants from Lithuania (18.5%, a difference of 0.53%).
| Demographics | Rating | Rank | Master's Degree |
| Immigrants | South Africa | 100.0 /100 | #51 | Exceptional 18.8% |
| Immigrants | Kuwait | 100.0 /100 | #52 | Exceptional 18.6% |
| Immigrants | Czechoslovakia | 99.9 /100 | #53 | Exceptional 18.5% |
| Immigrants | Lithuania | 99.9 /100 | #54 | Exceptional 18.5% |
| Immigrants | Serbia | 99.9 /100 | #55 | Exceptional 18.5% |
| Asians | 99.9 /100 | #56 | Exceptional 18.4% |
| Immigrants | Asia | 99.9 /100 | #57 | Exceptional 18.4% |
| Australians | 99.9 /100 | #58 | Exceptional 18.4% |
| Immigrants | Bulgaria | 99.9 /100 | #59 | Exceptional 18.3% |
| New Zealanders | 99.9 /100 | #60 | Exceptional 18.3% |
| Immigrants | Europe | 99.9 /100 | #61 | Exceptional 18.2% |
| Argentineans | 99.9 /100 | #62 | Exceptional 18.2% |
| Immigrants | Netherlands | 99.9 /100 | #63 | Exceptional 18.1% |
| South Africans | 99.9 /100 | #64 | Exceptional 18.1% |
| Immigrants | Kazakhstan | 99.8 /100 | #65 | Exceptional 18.0% |