Irish vs Ghanaian Master's Degree
COMPARE
Irish
Ghanaian
Master's Degree
Master's Degree Comparison
Irish
Ghanaians
15.0%
MASTER'S DEGREE
56.3/ 100
METRIC RATING
170th/ 347
METRIC RANK
15.5%
MASTER'S DEGREE
78.2/ 100
METRIC RATING
149th/ 347
METRIC RANK
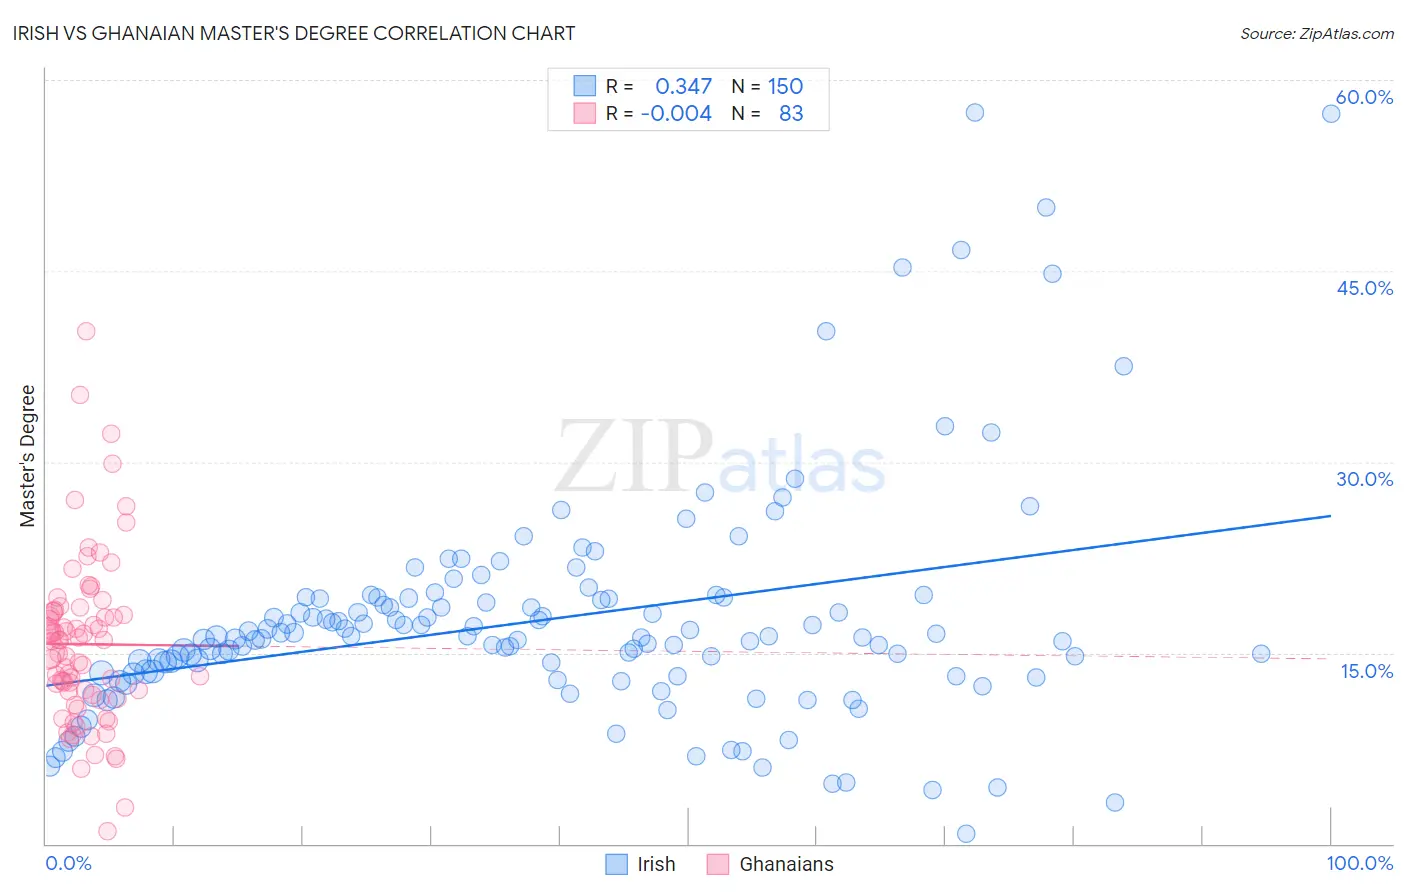
Irish vs Ghanaian Master's Degree Correlation Chart
The statistical analysis conducted on geographies consisting of 579,087,481 people shows a mild positive correlation between the proportion of Irish and percentage of population with at least master's degree education in the United States with a correlation coefficient (R) of 0.347 and weighted average of 15.0%. Similarly, the statistical analysis conducted on geographies consisting of 190,610,079 people shows no correlation between the proportion of Ghanaians and percentage of population with at least master's degree education in the United States with a correlation coefficient (R) of -0.004 and weighted average of 15.5%, a difference of 3.2%.
Master's Degree Correlation Summary
| Measurement | Irish | Ghanaian |
| Minimum | 0.78% | 0.95% |
| Maximum | 57.5% | 40.3% |
| Range | 56.7% | 39.3% |
| Mean | 17.6% | 15.7% |
| Median | 16.3% | 15.9% |
| Interquartile 25% (IQ1) | 13.4% | 11.7% |
| Interquartile 75% (IQ3) | 19.3% | 18.2% |
| Interquartile Range (IQR) | 5.9% | 6.5% |
| Standard Deviation (Sample) | 9.0% | 6.6% |
| Standard Deviation (Population) | 9.0% | 6.6% |
Similar Demographics by Master's Degree
Demographics Similar to Irish by Master's Degree
In terms of master's degree, the demographic groups most similar to Irish are Immigrants from Ghana (15.0%, a difference of 0.35%), Immigrants from Uruguay (15.0%, a difference of 0.46%), Costa Rican (15.0%, a difference of 0.50%), Slovak (14.9%, a difference of 0.81%), and Scottish (15.2%, a difference of 0.84%).
| Demographics | Rating | Rank | Master's Degree |
| Uruguayans | 67.1 /100 | #163 | Good 15.3% |
| Colombians | 66.9 /100 | #164 | Good 15.3% |
| Immigrants | Kenya | 66.6 /100 | #165 | Good 15.3% |
| Swedes | 66.1 /100 | #166 | Good 15.2% |
| Senegalese | 65.6 /100 | #167 | Good 15.2% |
| Immigrants | North Macedonia | 64.5 /100 | #168 | Good 15.2% |
| Scottish | 62.7 /100 | #169 | Good 15.2% |
| Irish | 56.3 /100 | #170 | Average 15.0% |
| Immigrants | Ghana | 53.6 /100 | #171 | Average 15.0% |
| Immigrants | Uruguay | 52.8 /100 | #172 | Average 15.0% |
| Costa Ricans | 52.5 /100 | #173 | Average 15.0% |
| Slovaks | 50.0 /100 | #174 | Average 14.9% |
| Immigrants | Peru | 49.6 /100 | #175 | Average 14.9% |
| Nigerians | 48.6 /100 | #176 | Average 14.9% |
| Immigrants | Colombia | 48.3 /100 | #177 | Average 14.9% |
Demographics Similar to Ghanaians by Master's Degree
In terms of master's degree, the demographic groups most similar to Ghanaians are Immigrants from Senegal (15.5%, a difference of 0.010%), Slovene (15.5%, a difference of 0.030%), Iraqi (15.5%, a difference of 0.16%), Hungarian (15.6%, a difference of 0.18%), and Slavic (15.5%, a difference of 0.21%).
| Demographics | Rating | Rank | Master's Degree |
| Immigrants | Africa | 84.0 /100 | #142 | Excellent 15.7% |
| Immigrants | Venezuela | 83.6 /100 | #143 | Excellent 15.7% |
| Canadians | 83.3 /100 | #144 | Excellent 15.7% |
| South Americans | 81.3 /100 | #145 | Excellent 15.6% |
| Immigrants | Afghanistan | 79.4 /100 | #146 | Good 15.6% |
| Hungarians | 79.1 /100 | #147 | Good 15.6% |
| Immigrants | Senegal | 78.2 /100 | #148 | Good 15.5% |
| Ghanaians | 78.2 /100 | #149 | Good 15.5% |
| Slovenes | 78.0 /100 | #150 | Good 15.5% |
| Iraqis | 77.3 /100 | #151 | Good 15.5% |
| Slavs | 77.0 /100 | #152 | Good 15.5% |
| Icelanders | 76.8 /100 | #153 | Good 15.5% |
| Immigrants | South America | 76.3 /100 | #154 | Good 15.5% |
| Immigrants | Bangladesh | 76.1 /100 | #155 | Good 15.5% |
| Bermudans | 73.9 /100 | #156 | Good 15.4% |