Irish vs Immigrants from Northern Europe Master's Degree
COMPARE
Irish
Immigrants from Northern Europe
Master's Degree
Master's Degree Comparison
Irish
Immigrants from Northern Europe
15.0%
MASTER'S DEGREE
56.3/ 100
METRIC RATING
170th/ 347
METRIC RANK
19.5%
MASTER'S DEGREE
100.0/ 100
METRIC RATING
35th/ 347
METRIC RANK
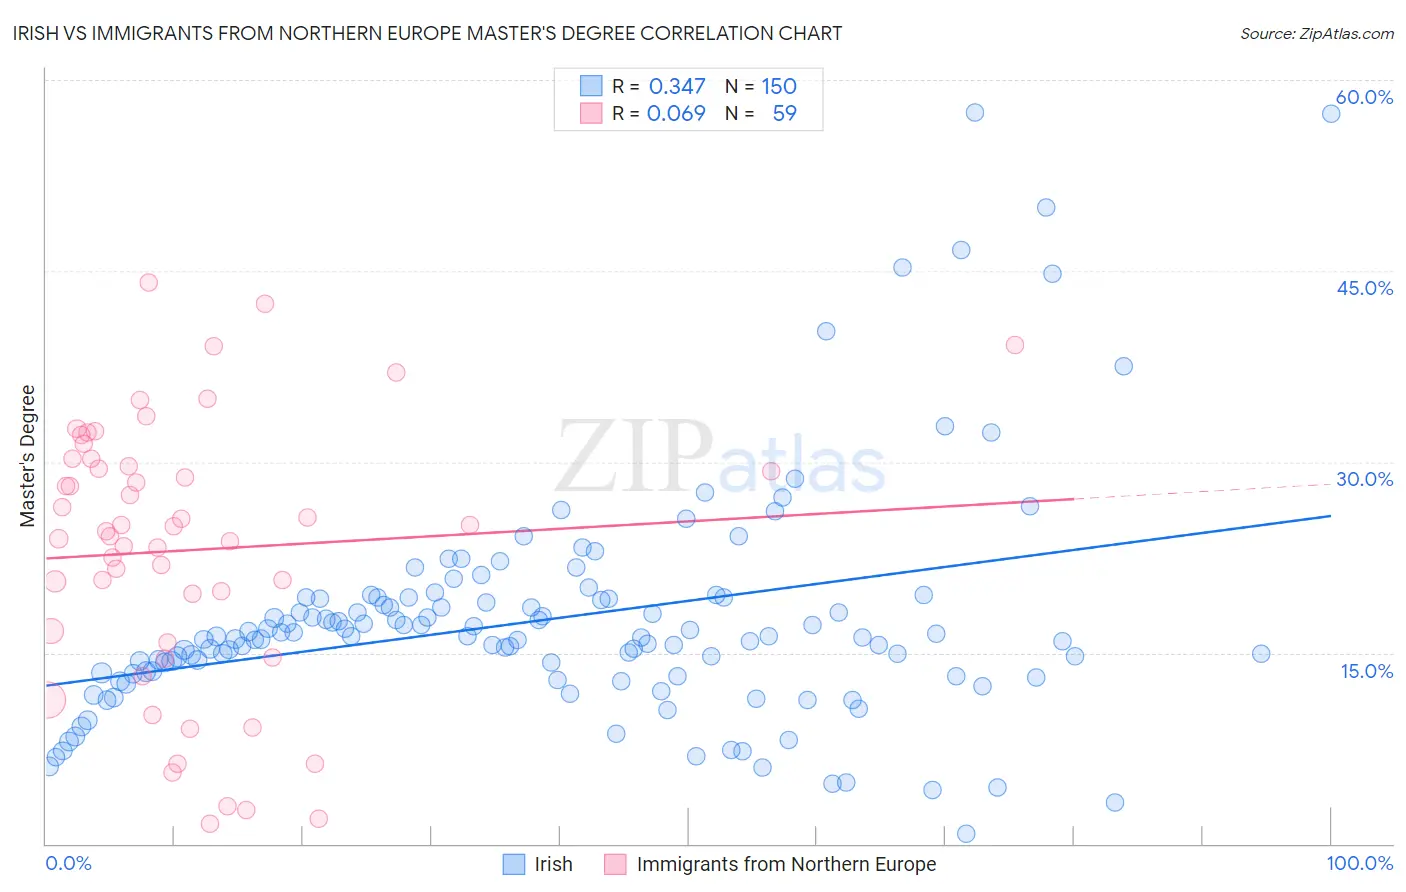
Irish vs Immigrants from Northern Europe Master's Degree Correlation Chart
The statistical analysis conducted on geographies consisting of 579,087,481 people shows a mild positive correlation between the proportion of Irish and percentage of population with at least master's degree education in the United States with a correlation coefficient (R) of 0.347 and weighted average of 15.0%. Similarly, the statistical analysis conducted on geographies consisting of 477,052,190 people shows a slight positive correlation between the proportion of Immigrants from Northern Europe and percentage of population with at least master's degree education in the United States with a correlation coefficient (R) of 0.069 and weighted average of 19.5%, a difference of 29.5%.
Master's Degree Correlation Summary
| Measurement | Irish | Immigrants from Northern Europe |
| Minimum | 0.78% | 1.5% |
| Maximum | 57.5% | 44.1% |
| Range | 56.7% | 42.6% |
| Mean | 17.6% | 23.1% |
| Median | 16.3% | 24.6% |
| Interquartile 25% (IQ1) | 13.4% | 15.8% |
| Interquartile 75% (IQ3) | 19.3% | 30.2% |
| Interquartile Range (IQR) | 5.9% | 14.4% |
| Standard Deviation (Sample) | 9.0% | 10.5% |
| Standard Deviation (Population) | 9.0% | 10.4% |
Similar Demographics by Master's Degree
Demographics Similar to Irish by Master's Degree
In terms of master's degree, the demographic groups most similar to Irish are Immigrants from Ghana (15.0%, a difference of 0.35%), Immigrants from Uruguay (15.0%, a difference of 0.46%), Costa Rican (15.0%, a difference of 0.50%), Slovak (14.9%, a difference of 0.81%), and Scottish (15.2%, a difference of 0.84%).
| Demographics | Rating | Rank | Master's Degree |
| Uruguayans | 67.1 /100 | #163 | Good 15.3% |
| Colombians | 66.9 /100 | #164 | Good 15.3% |
| Immigrants | Kenya | 66.6 /100 | #165 | Good 15.3% |
| Swedes | 66.1 /100 | #166 | Good 15.2% |
| Senegalese | 65.6 /100 | #167 | Good 15.2% |
| Immigrants | North Macedonia | 64.5 /100 | #168 | Good 15.2% |
| Scottish | 62.7 /100 | #169 | Good 15.2% |
| Irish | 56.3 /100 | #170 | Average 15.0% |
| Immigrants | Ghana | 53.6 /100 | #171 | Average 15.0% |
| Immigrants | Uruguay | 52.8 /100 | #172 | Average 15.0% |
| Costa Ricans | 52.5 /100 | #173 | Average 15.0% |
| Slovaks | 50.0 /100 | #174 | Average 14.9% |
| Immigrants | Peru | 49.6 /100 | #175 | Average 14.9% |
| Nigerians | 48.6 /100 | #176 | Average 14.9% |
| Immigrants | Colombia | 48.3 /100 | #177 | Average 14.9% |
Demographics Similar to Immigrants from Northern Europe by Master's Degree
In terms of master's degree, the demographic groups most similar to Immigrants from Northern Europe are Immigrants from Denmark (19.5%, a difference of 0.33%), Russian (19.5%, a difference of 0.36%), Immigrants from Russia (19.4%, a difference of 0.37%), Mongolian (19.4%, a difference of 0.41%), and Bolivian (19.3%, a difference of 1.1%).
| Demographics | Rating | Rank | Master's Degree |
| Turks | 100.0 /100 | #28 | Exceptional 19.9% |
| Latvians | 100.0 /100 | #29 | Exceptional 19.8% |
| Immigrants | Turkey | 100.0 /100 | #30 | Exceptional 19.7% |
| Immigrants | Korea | 100.0 /100 | #31 | Exceptional 19.7% |
| Burmese | 100.0 /100 | #32 | Exceptional 19.7% |
| Russians | 100.0 /100 | #33 | Exceptional 19.5% |
| Immigrants | Denmark | 100.0 /100 | #34 | Exceptional 19.5% |
| Immigrants | Northern Europe | 100.0 /100 | #35 | Exceptional 19.5% |
| Immigrants | Russia | 100.0 /100 | #36 | Exceptional 19.4% |
| Mongolians | 100.0 /100 | #37 | Exceptional 19.4% |
| Bolivians | 100.0 /100 | #38 | Exceptional 19.3% |
| Immigrants | Spain | 100.0 /100 | #39 | Exceptional 19.1% |
| Immigrants | Bolivia | 100.0 /100 | #40 | Exceptional 19.1% |
| Immigrants | Latvia | 100.0 /100 | #41 | Exceptional 19.1% |
| Immigrants | Saudi Arabia | 100.0 /100 | #42 | Exceptional 19.0% |