Irish vs Central American Female Poverty Among 25-34 Year Olds
COMPARE
Irish
Central American
Female Poverty Among 25-34 Year Olds
Female Poverty Among 25-34 Year Olds Comparison
Irish
Central Americans
13.7%
FEMALE POVERTY AMONG 25-34 YEAR OLDS
35.3/ 100
METRIC RATING
185th/ 347
METRIC RANK
15.5%
FEMALE POVERTY AMONG 25-34 YEAR OLDS
0.1/ 100
METRIC RATING
267th/ 347
METRIC RANK
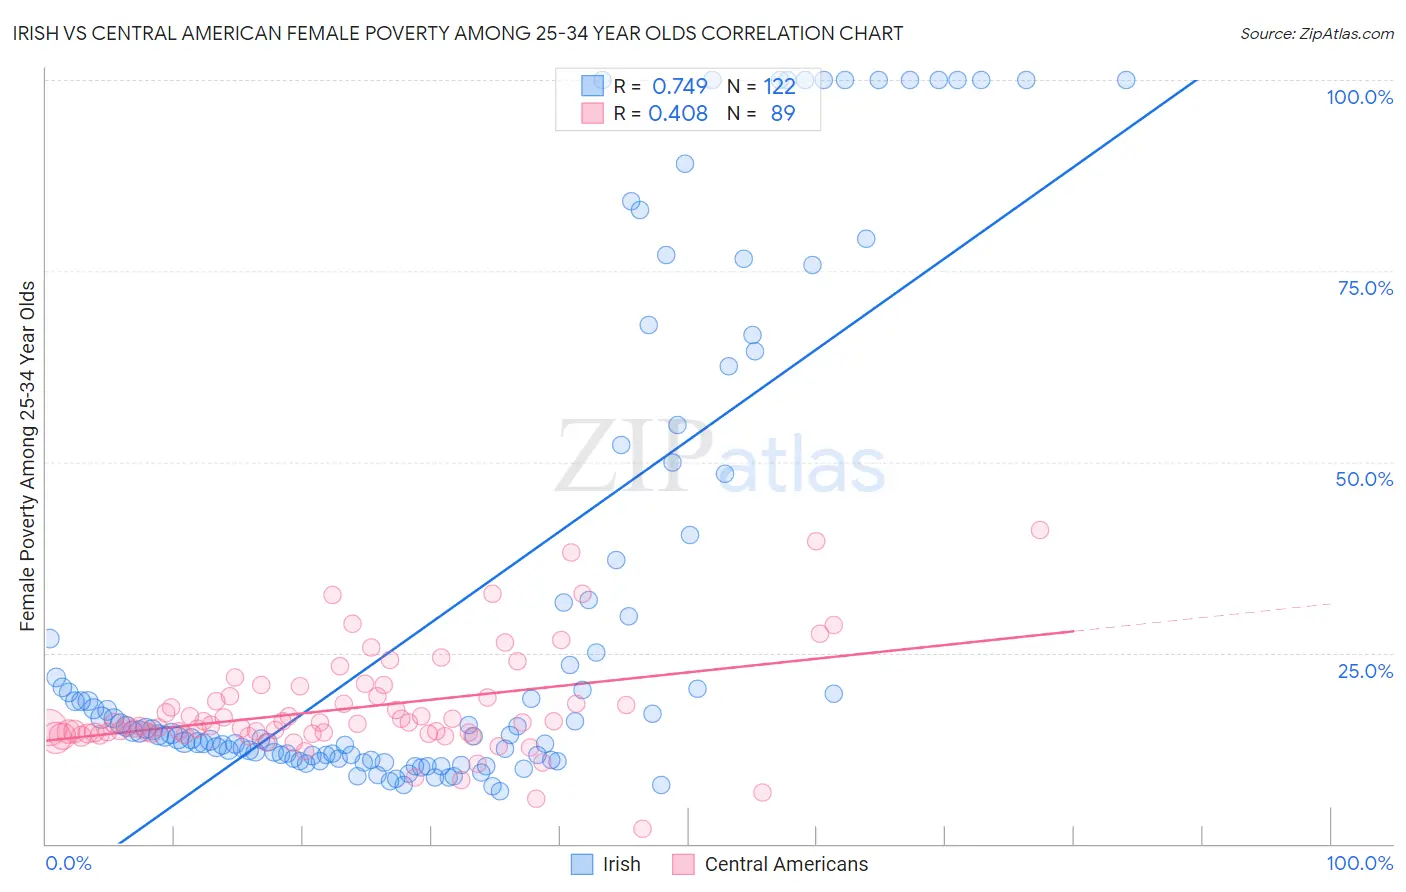
Irish vs Central American Female Poverty Among 25-34 Year Olds Correlation Chart
The statistical analysis conducted on geographies consisting of 555,342,984 people shows a strong positive correlation between the proportion of Irish and poverty level among females between the ages 25 and 34 in the United States with a correlation coefficient (R) of 0.749 and weighted average of 13.7%. Similarly, the statistical analysis conducted on geographies consisting of 493,853,689 people shows a moderate positive correlation between the proportion of Central Americans and poverty level among females between the ages 25 and 34 in the United States with a correlation coefficient (R) of 0.408 and weighted average of 15.5%, a difference of 13.0%.
Female Poverty Among 25-34 Year Olds Correlation Summary
| Measurement | Irish | Central American |
| Minimum | 6.8% | 2.0% |
| Maximum | 100.0% | 41.0% |
| Range | 93.2% | 39.0% |
| Mean | 31.0% | 17.7% |
| Median | 14.6% | 15.8% |
| Interquartile 25% (IQ1) | 11.5% | 14.4% |
| Interquartile 75% (IQ3) | 37.1% | 19.4% |
| Interquartile Range (IQR) | 25.6% | 5.0% |
| Standard Deviation (Sample) | 31.4% | 6.8% |
| Standard Deviation (Population) | 31.3% | 6.8% |
Similar Demographics by Female Poverty Among 25-34 Year Olds
Demographics Similar to Irish by Female Poverty Among 25-34 Year Olds
In terms of female poverty among 25-34 year olds, the demographic groups most similar to Irish are Immigrants from Uruguay (13.7%, a difference of 0.11%), Slovak (13.7%, a difference of 0.11%), Czechoslovakian (13.7%, a difference of 0.13%), Immigrants from Eritrea (13.7%, a difference of 0.24%), and Finnish (13.7%, a difference of 0.26%).
| Demographics | Rating | Rank | Female Poverty Among 25-34 Year Olds |
| Canadians | 44.3 /100 | #178 | Average 13.6% |
| Immigrants | Eastern Africa | 43.6 /100 | #179 | Average 13.6% |
| Germans | 41.6 /100 | #180 | Average 13.6% |
| Guamanians/Chamorros | 41.5 /100 | #181 | Average 13.6% |
| Immigrants | Venezuela | 40.7 /100 | #182 | Average 13.6% |
| Portuguese | 40.3 /100 | #183 | Average 13.6% |
| Czechoslovakians | 36.8 /100 | #184 | Fair 13.7% |
| Irish | 35.3 /100 | #185 | Fair 13.7% |
| Immigrants | Uruguay | 34.1 /100 | #186 | Fair 13.7% |
| Slovaks | 34.1 /100 | #187 | Fair 13.7% |
| Immigrants | Eritrea | 32.7 /100 | #188 | Fair 13.7% |
| Finns | 32.5 /100 | #189 | Fair 13.7% |
| Dutch | 29.7 /100 | #190 | Fair 13.8% |
| Immigrants | St. Vincent and the Grenadines | 29.3 /100 | #191 | Fair 13.8% |
| Tlingit-Haida | 28.1 /100 | #192 | Fair 13.8% |
Demographics Similar to Central Americans by Female Poverty Among 25-34 Year Olds
In terms of female poverty among 25-34 year olds, the demographic groups most similar to Central Americans are Immigrants from Somalia (15.4%, a difference of 0.38%), Immigrants from Liberia (15.4%, a difference of 0.39%), Pennsylvania German (15.4%, a difference of 0.42%), Immigrants from Senegal (15.6%, a difference of 0.42%), and Subsaharan African (15.6%, a difference of 0.64%).
| Demographics | Rating | Rank | Female Poverty Among 25-34 Year Olds |
| Marshallese | 0.2 /100 | #260 | Tragic 15.3% |
| Liberians | 0.2 /100 | #261 | Tragic 15.3% |
| Immigrants | Belize | 0.2 /100 | #262 | Tragic 15.3% |
| Mexican American Indians | 0.2 /100 | #263 | Tragic 15.4% |
| Pennsylvania Germans | 0.1 /100 | #264 | Tragic 15.4% |
| Immigrants | Liberia | 0.1 /100 | #265 | Tragic 15.4% |
| Immigrants | Somalia | 0.1 /100 | #266 | Tragic 15.4% |
| Central Americans | 0.1 /100 | #267 | Tragic 15.5% |
| Immigrants | Senegal | 0.1 /100 | #268 | Tragic 15.6% |
| Sub-Saharan Africans | 0.1 /100 | #269 | Tragic 15.6% |
| British West Indians | 0.1 /100 | #270 | Tragic 15.6% |
| Cree | 0.1 /100 | #271 | Tragic 15.6% |
| Senegalese | 0.1 /100 | #272 | Tragic 15.6% |
| Immigrants | Nonimmigrants | 0.1 /100 | #273 | Tragic 15.6% |
| Immigrants | Caribbean | 0.0 /100 | #274 | Tragic 15.7% |