Immigrants from Poland vs Australian Master's Degree
COMPARE
Immigrants from Poland
Australian
Master's Degree
Master's Degree Comparison
Immigrants from Poland
Australians
15.4%
MASTER'S DEGREE
71.5/ 100
METRIC RATING
158th/ 347
METRIC RANK
18.4%
MASTER'S DEGREE
99.9/ 100
METRIC RATING
58th/ 347
METRIC RANK
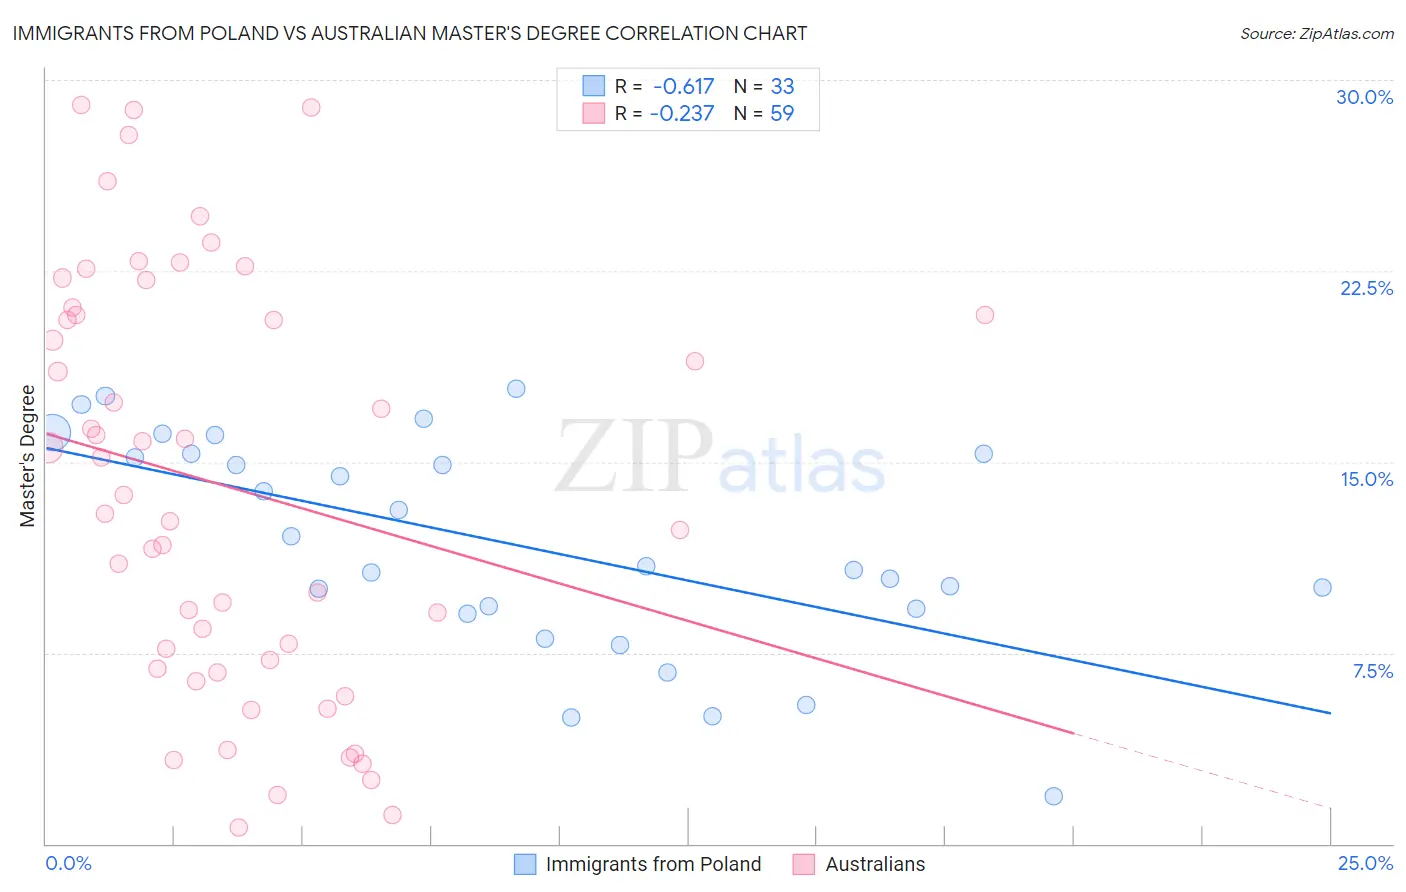
Immigrants from Poland vs Australian Master's Degree Correlation Chart
The statistical analysis conducted on geographies consisting of 304,812,257 people shows a significant negative correlation between the proportion of Immigrants from Poland and percentage of population with at least master's degree education in the United States with a correlation coefficient (R) of -0.617 and weighted average of 15.4%. Similarly, the statistical analysis conducted on geographies consisting of 224,102,387 people shows a weak negative correlation between the proportion of Australians and percentage of population with at least master's degree education in the United States with a correlation coefficient (R) of -0.237 and weighted average of 18.4%, a difference of 19.8%.
Master's Degree Correlation Summary
| Measurement | Immigrants from Poland | Australian |
| Minimum | 1.9% | 0.65% |
| Maximum | 17.9% | 29.0% |
| Range | 16.0% | 28.4% |
| Mean | 11.7% | 14.0% |
| Median | 10.9% | 13.7% |
| Interquartile 25% (IQ1) | 9.1% | 6.9% |
| Interquartile 75% (IQ3) | 15.3% | 20.7% |
| Interquartile Range (IQR) | 6.2% | 13.9% |
| Standard Deviation (Sample) | 4.2% | 8.1% |
| Standard Deviation (Population) | 4.2% | 8.1% |
Similar Demographics by Master's Degree
Demographics Similar to Immigrants from Poland by Master's Degree
In terms of master's degree, the demographic groups most similar to Immigrants from Poland are Immigrants from Cameroon (15.4%, a difference of 0.040%), Luxembourger (15.3%, a difference of 0.070%), Kenyan (15.3%, a difference of 0.18%), Bermudan (15.4%, a difference of 0.39%), and Sudanese (15.3%, a difference of 0.41%).
| Demographics | Rating | Rank | Master's Degree |
| Iraqis | 77.3 /100 | #151 | Good 15.5% |
| Slavs | 77.0 /100 | #152 | Good 15.5% |
| Icelanders | 76.8 /100 | #153 | Good 15.5% |
| Immigrants | South America | 76.3 /100 | #154 | Good 15.5% |
| Immigrants | Bangladesh | 76.1 /100 | #155 | Good 15.5% |
| Bermudans | 73.9 /100 | #156 | Good 15.4% |
| Immigrants | Cameroon | 71.7 /100 | #157 | Good 15.4% |
| Immigrants | Poland | 71.5 /100 | #158 | Good 15.4% |
| Luxembourgers | 71.0 /100 | #159 | Good 15.3% |
| Kenyans | 70.3 /100 | #160 | Good 15.3% |
| Sudanese | 68.7 /100 | #161 | Good 15.3% |
| Peruvians | 68.7 /100 | #162 | Good 15.3% |
| Uruguayans | 67.1 /100 | #163 | Good 15.3% |
| Colombians | 66.9 /100 | #164 | Good 15.3% |
| Immigrants | Kenya | 66.6 /100 | #165 | Good 15.3% |
Demographics Similar to Australians by Master's Degree
In terms of master's degree, the demographic groups most similar to Australians are Immigrants from Asia (18.4%, a difference of 0.13%), Asian (18.4%, a difference of 0.27%), Immigrants from Bulgaria (18.3%, a difference of 0.44%), Immigrants from Serbia (18.5%, a difference of 0.49%), and Immigrants from Lithuania (18.5%, a difference of 0.53%).
| Demographics | Rating | Rank | Master's Degree |
| Immigrants | South Africa | 100.0 /100 | #51 | Exceptional 18.8% |
| Immigrants | Kuwait | 100.0 /100 | #52 | Exceptional 18.6% |
| Immigrants | Czechoslovakia | 99.9 /100 | #53 | Exceptional 18.5% |
| Immigrants | Lithuania | 99.9 /100 | #54 | Exceptional 18.5% |
| Immigrants | Serbia | 99.9 /100 | #55 | Exceptional 18.5% |
| Asians | 99.9 /100 | #56 | Exceptional 18.4% |
| Immigrants | Asia | 99.9 /100 | #57 | Exceptional 18.4% |
| Australians | 99.9 /100 | #58 | Exceptional 18.4% |
| Immigrants | Bulgaria | 99.9 /100 | #59 | Exceptional 18.3% |
| New Zealanders | 99.9 /100 | #60 | Exceptional 18.3% |
| Immigrants | Europe | 99.9 /100 | #61 | Exceptional 18.2% |
| Argentineans | 99.9 /100 | #62 | Exceptional 18.2% |
| Immigrants | Netherlands | 99.9 /100 | #63 | Exceptional 18.1% |
| South Africans | 99.9 /100 | #64 | Exceptional 18.1% |
| Immigrants | Kazakhstan | 99.8 /100 | #65 | Exceptional 18.0% |