Irish vs Australian Unemployment Among Women with Children Under 6 years
COMPARE
Irish
Australian
Unemployment Among Women with Children Under 6 years
Unemployment Among Women with Children Under 6 years Comparison
Irish
Australians
8.1%
UNEMPLOYMENT AMONG WOMEN WITH CHILDREN UNDER 6 YEARS
2.7/ 100
METRIC RATING
239th/ 347
METRIC RANK
7.2%
UNEMPLOYMENT AMONG WOMEN WITH CHILDREN UNDER 6 YEARS
96.9/ 100
METRIC RATING
109th/ 347
METRIC RANK
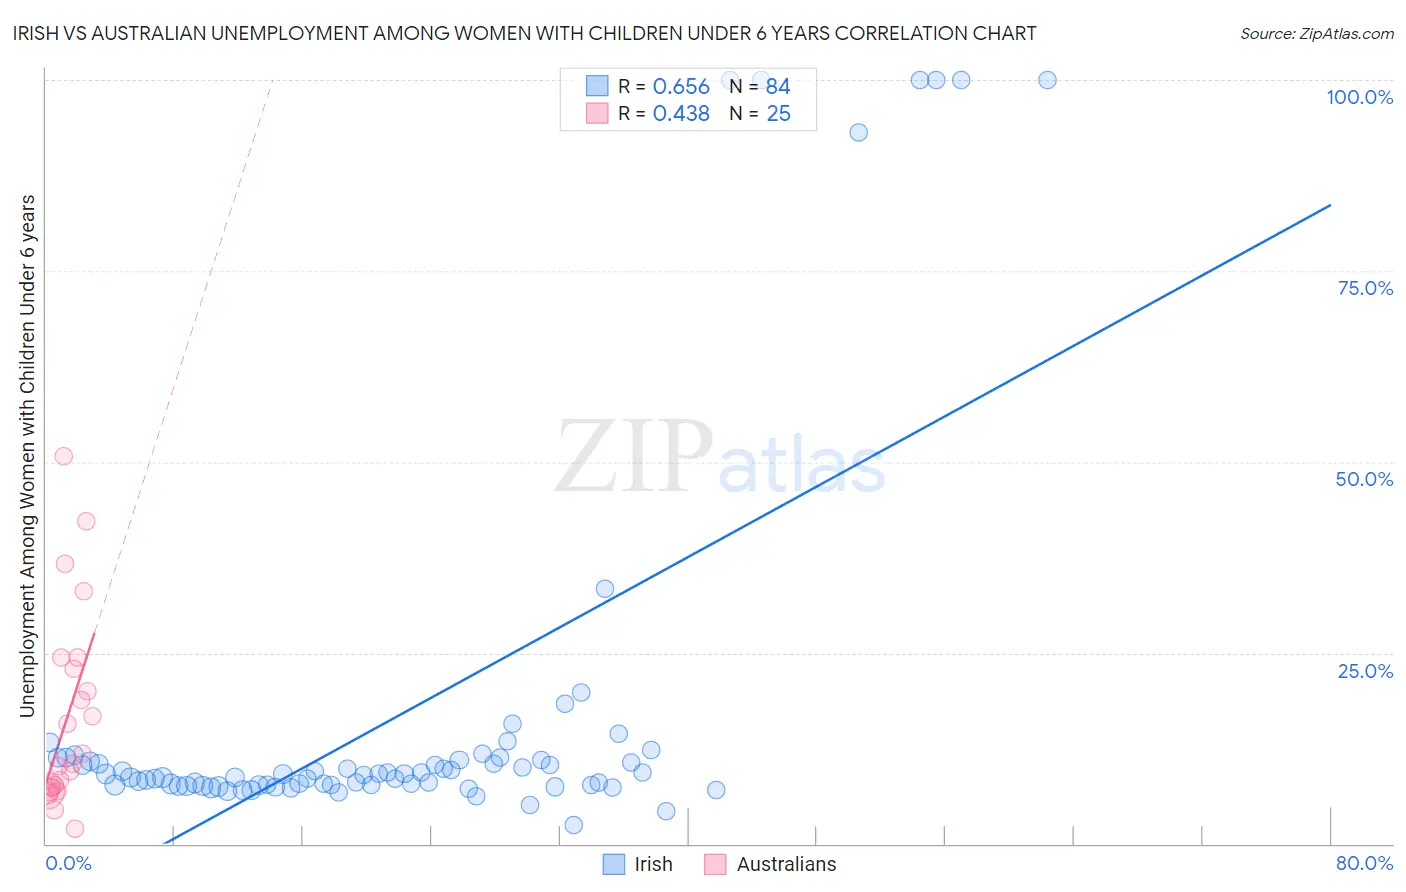
Irish vs Australian Unemployment Among Women with Children Under 6 years Correlation Chart
The statistical analysis conducted on geographies consisting of 378,985,462 people shows a significant positive correlation between the proportion of Irish and unemployment rate among women with children under the age of 6 in the United States with a correlation coefficient (R) of 0.656 and weighted average of 8.1%. Similarly, the statistical analysis conducted on geographies consisting of 184,780,625 people shows a moderate positive correlation between the proportion of Australians and unemployment rate among women with children under the age of 6 in the United States with a correlation coefficient (R) of 0.438 and weighted average of 7.2%, a difference of 12.3%.
Unemployment Among Women with Children Under 6 years Correlation Summary
| Measurement | Irish | Australian |
| Minimum | 2.5% | 1.9% |
| Maximum | 100.0% | 50.8% |
| Range | 97.5% | 48.9% |
| Mean | 16.9% | 16.5% |
| Median | 9.1% | 10.4% |
| Interquartile 25% (IQ1) | 7.7% | 7.2% |
| Interquartile 75% (IQ3) | 11.0% | 23.7% |
| Interquartile Range (IQR) | 3.3% | 16.5% |
| Standard Deviation (Sample) | 25.2% | 12.7% |
| Standard Deviation (Population) | 25.0% | 12.5% |
Similar Demographics by Unemployment Among Women with Children Under 6 years
Demographics Similar to Irish by Unemployment Among Women with Children Under 6 years
In terms of unemployment among women with children under 6 years, the demographic groups most similar to Irish are Immigrants from El Salvador (8.1%, a difference of 0.070%), Liberian (8.1%, a difference of 0.10%), Dutch (8.1%, a difference of 0.16%), Immigrants from Middle Africa (8.1%, a difference of 0.26%), and Immigrants from Costa Rica (8.0%, a difference of 0.65%).
| Demographics | Rating | Rank | Unemployment Among Women with Children Under 6 years |
| Welsh | 5.0 /100 | #232 | Tragic 8.0% |
| Immigrants | Trinidad and Tobago | 4.8 /100 | #233 | Tragic 8.0% |
| Kiowa | 4.4 /100 | #234 | Tragic 8.0% |
| Comanche | 4.3 /100 | #235 | Tragic 8.0% |
| Immigrants | Barbados | 4.2 /100 | #236 | Tragic 8.0% |
| Immigrants | Costa Rica | 4.1 /100 | #237 | Tragic 8.0% |
| Immigrants | Middle Africa | 3.2 /100 | #238 | Tragic 8.1% |
| Irish | 2.7 /100 | #239 | Tragic 8.1% |
| Immigrants | El Salvador | 2.6 /100 | #240 | Tragic 8.1% |
| Liberians | 2.6 /100 | #241 | Tragic 8.1% |
| Dutch | 2.5 /100 | #242 | Tragic 8.1% |
| Hawaiians | 1.8 /100 | #243 | Tragic 8.2% |
| French | 1.7 /100 | #244 | Tragic 8.2% |
| Native Hawaiians | 1.7 /100 | #245 | Tragic 8.2% |
| Central Americans | 1.4 /100 | #246 | Tragic 8.2% |
Demographics Similar to Australians by Unemployment Among Women with Children Under 6 years
In terms of unemployment among women with children under 6 years, the demographic groups most similar to Australians are Eastern European (7.2%, a difference of 0.010%), Palestinian (7.2%, a difference of 0.070%), Immigrants from Kazakhstan (7.2%, a difference of 0.13%), Norwegian (7.2%, a difference of 0.13%), and Immigrants from Pakistan (7.2%, a difference of 0.14%).
| Demographics | Rating | Rank | Unemployment Among Women with Children Under 6 years |
| Immigrants | Nicaragua | 97.3 /100 | #102 | Exceptional 7.2% |
| Immigrants | Saudi Arabia | 97.3 /100 | #103 | Exceptional 7.2% |
| Immigrants | Egypt | 97.2 /100 | #104 | Exceptional 7.2% |
| Venezuelans | 97.2 /100 | #105 | Exceptional 7.2% |
| Immigrants | Pakistan | 97.2 /100 | #106 | Exceptional 7.2% |
| Immigrants | Kazakhstan | 97.1 /100 | #107 | Exceptional 7.2% |
| Eastern Europeans | 96.9 /100 | #108 | Exceptional 7.2% |
| Australians | 96.9 /100 | #109 | Exceptional 7.2% |
| Palestinians | 96.8 /100 | #110 | Exceptional 7.2% |
| Norwegians | 96.7 /100 | #111 | Exceptional 7.2% |
| Israelis | 96.5 /100 | #112 | Exceptional 7.2% |
| Nicaraguans | 96.3 /100 | #113 | Exceptional 7.2% |
| Argentineans | 96.2 /100 | #114 | Exceptional 7.2% |
| Immigrants | Italy | 96.1 /100 | #115 | Exceptional 7.2% |
| Armenians | 95.9 /100 | #116 | Exceptional 7.2% |