Irish vs Alsatian 2nd Grade
COMPARE
Irish
Alsatian
2nd Grade
2nd Grade Comparison
Irish
Alsatians
98.6%
2ND GRADE
100.0/ 100
METRIC RATING
18th/ 347
METRIC RANK
98.0%
2ND GRADE
80.5/ 100
METRIC RATING
143rd/ 347
METRIC RANK
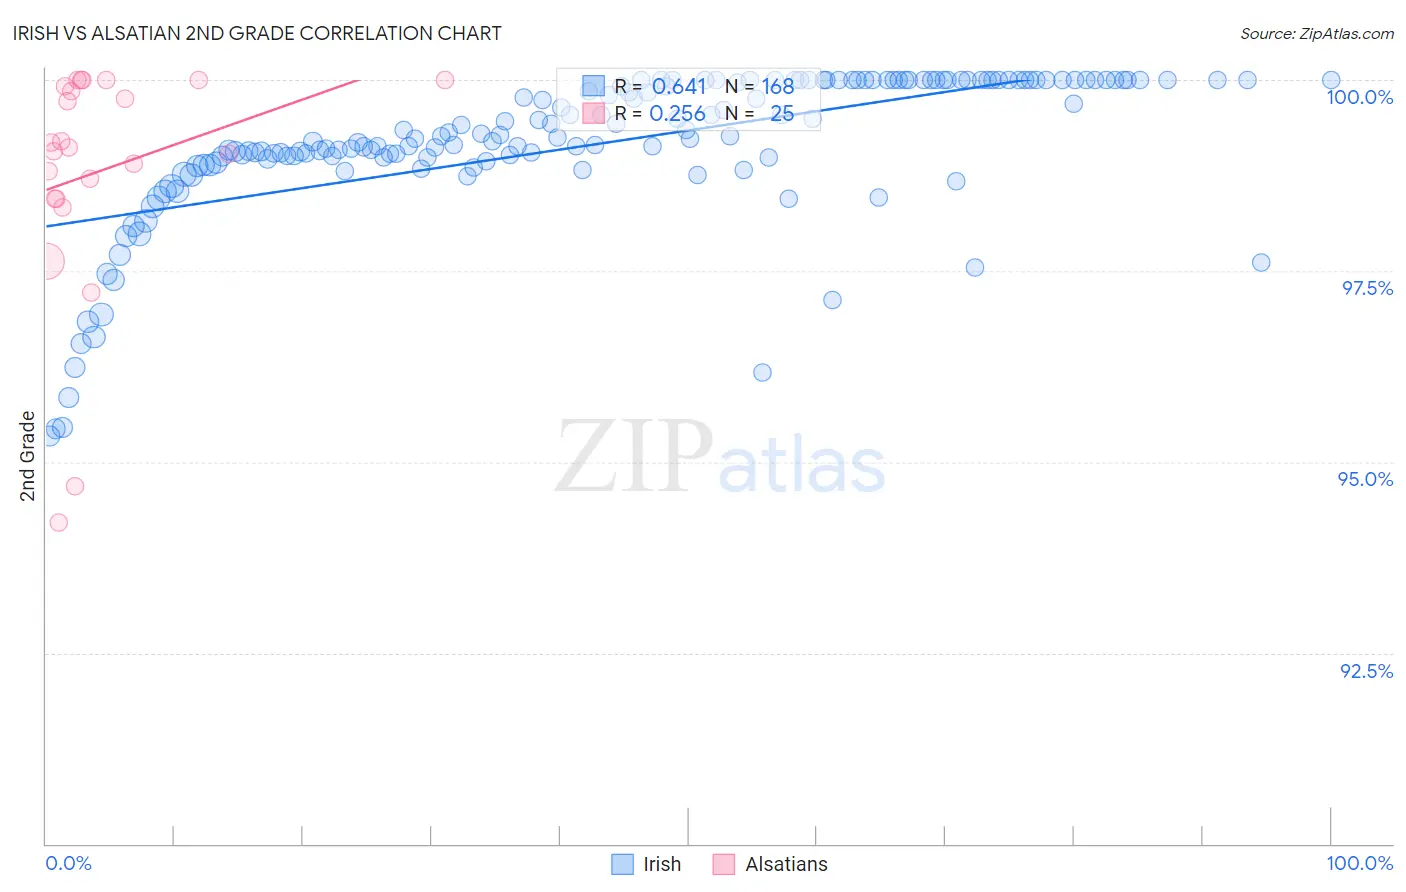
Irish vs Alsatian 2nd Grade Correlation Chart
The statistical analysis conducted on geographies consisting of 580,708,963 people shows a significant positive correlation between the proportion of Irish and percentage of population with at least 2nd grade education in the United States with a correlation coefficient (R) of 0.641 and weighted average of 98.6%. Similarly, the statistical analysis conducted on geographies consisting of 82,682,365 people shows a weak positive correlation between the proportion of Alsatians and percentage of population with at least 2nd grade education in the United States with a correlation coefficient (R) of 0.256 and weighted average of 98.0%, a difference of 0.60%.
2nd Grade Correlation Summary
| Measurement | Irish | Alsatian |
| Minimum | 95.3% | 94.2% |
| Maximum | 100.0% | 100.0% |
| Range | 4.7% | 5.8% |
| Mean | 99.2% | 98.8% |
| Median | 99.3% | 99.1% |
| Interquartile 25% (IQ1) | 98.9% | 98.4% |
| Interquartile 75% (IQ3) | 100.0% | 100.0% |
| Interquartile Range (IQR) | 1.1% | 1.5% |
| Standard Deviation (Sample) | 1.00% | 1.5% |
| Standard Deviation (Population) | 0.99% | 1.5% |
Similar Demographics by 2nd Grade
Demographics Similar to Irish by 2nd Grade
In terms of 2nd grade, the demographic groups most similar to Irish are Aleut (98.6%, a difference of 0.0%), Finnish (98.5%, a difference of 0.010%), Sioux (98.5%, a difference of 0.010%), Lithuanian (98.5%, a difference of 0.010%), and Polish (98.5%, a difference of 0.010%).
| Demographics | Rating | Rank | 2nd Grade |
| Tlingit-Haida | 100.0 /100 | #11 | Exceptional 98.6% |
| Carpatho Rusyns | 100.0 /100 | #12 | Exceptional 98.6% |
| English | 100.0 /100 | #13 | Exceptional 98.6% |
| Swedes | 100.0 /100 | #14 | Exceptional 98.6% |
| Scottish | 100.0 /100 | #15 | Exceptional 98.6% |
| Dutch | 100.0 /100 | #16 | Exceptional 98.6% |
| Aleuts | 100.0 /100 | #17 | Exceptional 98.6% |
| Irish | 100.0 /100 | #18 | Exceptional 98.6% |
| Finns | 100.0 /100 | #19 | Exceptional 98.5% |
| Sioux | 100.0 /100 | #20 | Exceptional 98.5% |
| Lithuanians | 100.0 /100 | #21 | Exceptional 98.5% |
| Poles | 100.0 /100 | #22 | Exceptional 98.5% |
| Danes | 100.0 /100 | #23 | Exceptional 98.5% |
| Pennsylvania Germans | 100.0 /100 | #24 | Exceptional 98.5% |
| Scotch-Irish | 100.0 /100 | #25 | Exceptional 98.5% |
Demographics Similar to Alsatians by 2nd Grade
In terms of 2nd grade, the demographic groups most similar to Alsatians are Burmese (98.0%, a difference of 0.0%), Hmong (98.0%, a difference of 0.0%), Immigrants from Turkey (98.0%, a difference of 0.010%), Filipino (98.0%, a difference of 0.010%), and Immigrants from Israel (98.0%, a difference of 0.010%).
| Demographics | Rating | Rank | 2nd Grade |
| Immigrants | Kuwait | 89.2 /100 | #136 | Excellent 98.0% |
| Immigrants | Romania | 88.3 /100 | #137 | Excellent 98.0% |
| Israelis | 87.9 /100 | #138 | Excellent 98.0% |
| Blackfeet | 87.5 /100 | #139 | Excellent 98.0% |
| Palestinians | 83.9 /100 | #140 | Excellent 98.0% |
| Immigrants | Turkey | 83.0 /100 | #141 | Excellent 98.0% |
| Burmese | 81.0 /100 | #142 | Excellent 98.0% |
| Alsatians | 80.5 /100 | #143 | Excellent 98.0% |
| Hmong | 80.0 /100 | #144 | Good 98.0% |
| Filipinos | 79.2 /100 | #145 | Good 98.0% |
| Immigrants | Israel | 78.0 /100 | #146 | Good 98.0% |
| Immigrants | Greece | 76.8 /100 | #147 | Good 98.0% |
| Jordanians | 74.5 /100 | #148 | Good 98.0% |
| Apache | 74.0 /100 | #149 | Good 97.9% |
| Immigrants | Moldova | 72.9 /100 | #150 | Good 97.9% |