Iranian vs Immigrants from Germany 7th Grade
COMPARE
Iranian
Immigrants from Germany
7th Grade
7th Grade Comparison
Iranians
Immigrants from Germany
96.8%
7TH GRADE
99.6/ 100
METRIC RATING
69th/ 347
METRIC RANK
96.7%
7TH GRADE
98.7/ 100
METRIC RATING
97th/ 347
METRIC RANK
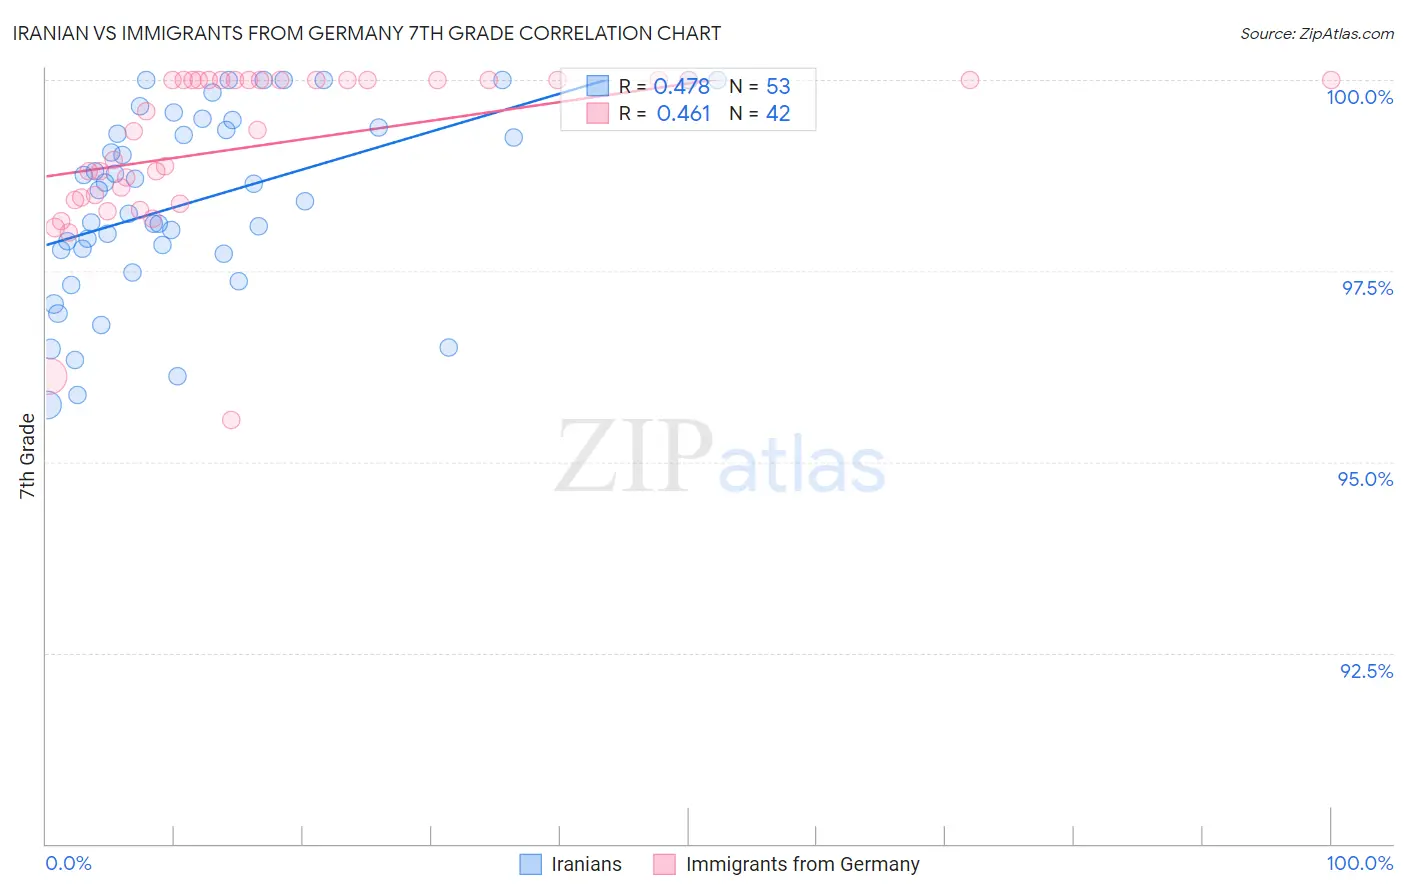
Iranian vs Immigrants from Germany 7th Grade Correlation Chart
The statistical analysis conducted on geographies consisting of 310,636,461 people shows a moderate positive correlation between the proportion of Iranians and percentage of population with at least 7th grade education in the United States with a correlation coefficient (R) of 0.478 and weighted average of 96.8%. Similarly, the statistical analysis conducted on geographies consisting of 463,886,845 people shows a moderate positive correlation between the proportion of Immigrants from Germany and percentage of population with at least 7th grade education in the United States with a correlation coefficient (R) of 0.461 and weighted average of 96.7%, a difference of 0.18%.
7th Grade Correlation Summary
| Measurement | Iranian | Immigrants from Germany |
| Minimum | 95.7% | 95.6% |
| Maximum | 100.0% | 100.0% |
| Range | 4.3% | 4.4% |
| Mean | 98.4% | 99.1% |
| Median | 98.6% | 99.5% |
| Interquartile 25% (IQ1) | 97.8% | 98.5% |
| Interquartile 75% (IQ3) | 99.4% | 100.0% |
| Interquartile Range (IQR) | 1.7% | 1.5% |
| Standard Deviation (Sample) | 1.2% | 1.1% |
| Standard Deviation (Population) | 1.2% | 1.0% |
Similar Demographics by 7th Grade
Demographics Similar to Iranians by 7th Grade
In terms of 7th grade, the demographic groups most similar to Iranians are New Zealander (96.8%, a difference of 0.0%), Immigrants from Lithuania (96.8%, a difference of 0.010%), Immigrants from India (96.9%, a difference of 0.020%), Cajun (96.8%, a difference of 0.020%), and Arapaho (96.8%, a difference of 0.030%).
| Demographics | Rating | Rank | 7th Grade |
| Immigrants | North America | 99.8 /100 | #62 | Exceptional 96.9% |
| Immigrants | Northern Europe | 99.7 /100 | #63 | Exceptional 96.9% |
| Immigrants | Austria | 99.7 /100 | #64 | Exceptional 96.9% |
| Canadians | 99.7 /100 | #65 | Exceptional 96.9% |
| Ukrainians | 99.7 /100 | #66 | Exceptional 96.9% |
| Native Hawaiians | 99.7 /100 | #67 | Exceptional 96.9% |
| Immigrants | India | 99.6 /100 | #68 | Exceptional 96.9% |
| Iranians | 99.6 /100 | #69 | Exceptional 96.8% |
| New Zealanders | 99.6 /100 | #70 | Exceptional 96.8% |
| Immigrants | Lithuania | 99.6 /100 | #71 | Exceptional 96.8% |
| Cajuns | 99.5 /100 | #72 | Exceptional 96.8% |
| Arapaho | 99.5 /100 | #73 | Exceptional 96.8% |
| Immigrants | England | 99.5 /100 | #74 | Exceptional 96.8% |
| Zimbabweans | 99.5 /100 | #75 | Exceptional 96.8% |
| Immigrants | Ireland | 99.4 /100 | #76 | Exceptional 96.8% |
Demographics Similar to Immigrants from Germany by 7th Grade
In terms of 7th grade, the demographic groups most similar to Immigrants from Germany are Immigrants from Denmark (96.7%, a difference of 0.0%), Immigrants from Sweden (96.7%, a difference of 0.0%), Menominee (96.7%, a difference of 0.0%), Immigrants from Australia (96.7%, a difference of 0.010%), and German Russian (96.7%, a difference of 0.010%).
| Demographics | Rating | Rank | 7th Grade |
| Immigrants | South Africa | 98.9 /100 | #90 | Exceptional 96.7% |
| Osage | 98.9 /100 | #91 | Exceptional 96.7% |
| Immigrants | Western Europe | 98.9 /100 | #92 | Exceptional 96.7% |
| Potawatomi | 98.9 /100 | #93 | Exceptional 96.7% |
| Lebanese | 98.8 /100 | #94 | Exceptional 96.7% |
| Immigrants | Australia | 98.8 /100 | #95 | Exceptional 96.7% |
| Immigrants | Denmark | 98.7 /100 | #96 | Exceptional 96.7% |
| Immigrants | Germany | 98.7 /100 | #97 | Exceptional 96.7% |
| Immigrants | Sweden | 98.7 /100 | #98 | Exceptional 96.7% |
| Menominee | 98.7 /100 | #99 | Exceptional 96.7% |
| German Russians | 98.6 /100 | #100 | Exceptional 96.7% |
| Thais | 98.6 /100 | #101 | Exceptional 96.7% |
| Immigrants | Czechoslovakia | 98.3 /100 | #102 | Exceptional 96.6% |
| Immigrants | Singapore | 98.3 /100 | #103 | Exceptional 96.6% |
| Shoshone | 98.1 /100 | #104 | Exceptional 96.6% |