Iranian vs Immigrants from Taiwan 7th Grade
COMPARE
Iranian
Immigrants from Taiwan
7th Grade
7th Grade Comparison
Iranians
Immigrants from Taiwan
96.8%
7TH GRADE
99.6/ 100
METRIC RATING
69th/ 347
METRIC RANK
96.1%
7TH GRADE
61.5/ 100
METRIC RATING
165th/ 347
METRIC RANK
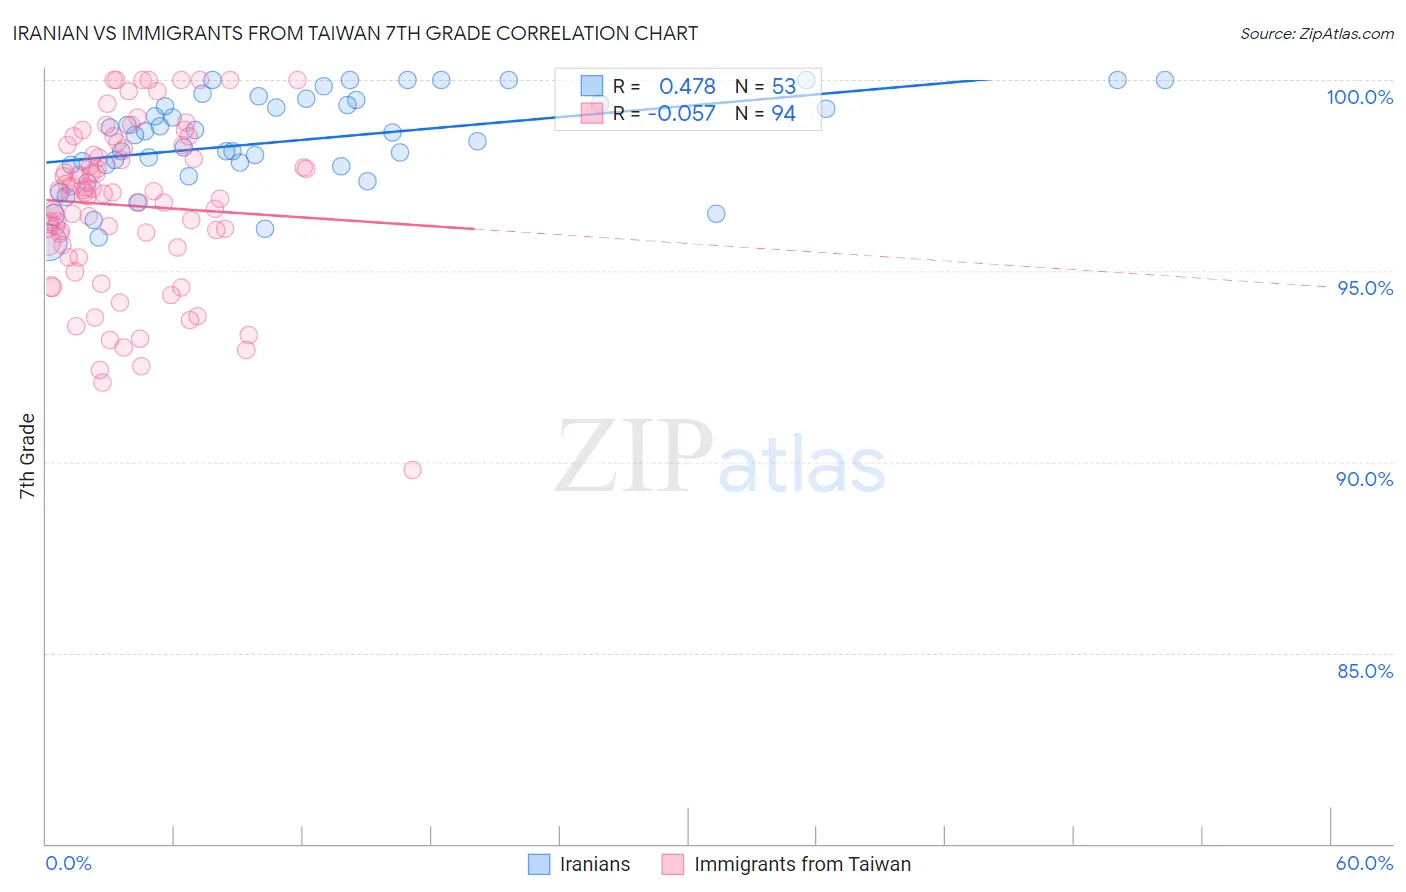
Iranian vs Immigrants from Taiwan 7th Grade Correlation Chart
The statistical analysis conducted on geographies consisting of 310,636,461 people shows a moderate positive correlation between the proportion of Iranians and percentage of population with at least 7th grade education in the United States with a correlation coefficient (R) of 0.478 and weighted average of 96.8%. Similarly, the statistical analysis conducted on geographies consisting of 298,069,199 people shows a slight negative correlation between the proportion of Immigrants from Taiwan and percentage of population with at least 7th grade education in the United States with a correlation coefficient (R) of -0.057 and weighted average of 96.1%, a difference of 0.77%.
7th Grade Correlation Summary
| Measurement | Iranian | Immigrants from Taiwan |
| Minimum | 95.7% | 89.8% |
| Maximum | 100.0% | 100.0% |
| Range | 4.3% | 10.2% |
| Mean | 98.4% | 96.7% |
| Median | 98.6% | 97.0% |
| Interquartile 25% (IQ1) | 97.8% | 95.7% |
| Interquartile 75% (IQ3) | 99.4% | 98.2% |
| Interquartile Range (IQR) | 1.7% | 2.5% |
| Standard Deviation (Sample) | 1.2% | 2.1% |
| Standard Deviation (Population) | 1.2% | 2.1% |
Similar Demographics by 7th Grade
Demographics Similar to Iranians by 7th Grade
In terms of 7th grade, the demographic groups most similar to Iranians are New Zealander (96.8%, a difference of 0.0%), Immigrants from Lithuania (96.8%, a difference of 0.010%), Immigrants from India (96.9%, a difference of 0.020%), Cajun (96.8%, a difference of 0.020%), and Arapaho (96.8%, a difference of 0.030%).
| Demographics | Rating | Rank | 7th Grade |
| Immigrants | North America | 99.8 /100 | #62 | Exceptional 96.9% |
| Immigrants | Northern Europe | 99.7 /100 | #63 | Exceptional 96.9% |
| Immigrants | Austria | 99.7 /100 | #64 | Exceptional 96.9% |
| Canadians | 99.7 /100 | #65 | Exceptional 96.9% |
| Ukrainians | 99.7 /100 | #66 | Exceptional 96.9% |
| Native Hawaiians | 99.7 /100 | #67 | Exceptional 96.9% |
| Immigrants | India | 99.6 /100 | #68 | Exceptional 96.9% |
| Iranians | 99.6 /100 | #69 | Exceptional 96.8% |
| New Zealanders | 99.6 /100 | #70 | Exceptional 96.8% |
| Immigrants | Lithuania | 99.6 /100 | #71 | Exceptional 96.8% |
| Cajuns | 99.5 /100 | #72 | Exceptional 96.8% |
| Arapaho | 99.5 /100 | #73 | Exceptional 96.8% |
| Immigrants | England | 99.5 /100 | #74 | Exceptional 96.8% |
| Zimbabweans | 99.5 /100 | #75 | Exceptional 96.8% |
| Immigrants | Ireland | 99.4 /100 | #76 | Exceptional 96.8% |
Demographics Similar to Immigrants from Taiwan by 7th Grade
In terms of 7th grade, the demographic groups most similar to Immigrants from Taiwan are Immigrants from Italy (96.1%, a difference of 0.0%), Immigrants from Kazakhstan (96.1%, a difference of 0.0%), Spaniard (96.1%, a difference of 0.010%), Immigrants from Sri Lanka (96.1%, a difference of 0.010%), and Pima (96.1%, a difference of 0.020%).
| Demographics | Rating | Rank | 7th Grade |
| Arabs | 68.6 /100 | #158 | Good 96.2% |
| Alsatians | 67.2 /100 | #159 | Good 96.1% |
| Immigrants | Kenya | 66.8 /100 | #160 | Good 96.1% |
| Bermudans | 66.3 /100 | #161 | Good 96.1% |
| Pima | 64.3 /100 | #162 | Good 96.1% |
| Spaniards | 62.6 /100 | #163 | Good 96.1% |
| Immigrants | Italy | 62.1 /100 | #164 | Good 96.1% |
| Immigrants | Taiwan | 61.5 /100 | #165 | Good 96.1% |
| Immigrants | Kazakhstan | 61.0 /100 | #166 | Good 96.1% |
| Immigrants | Sri Lanka | 59.9 /100 | #167 | Average 96.1% |
| Immigrants | Poland | 59.0 /100 | #168 | Average 96.1% |
| Ute | 55.8 /100 | #169 | Average 96.1% |
| Immigrants | Ukraine | 55.0 /100 | #170 | Average 96.1% |
| Egyptians | 54.2 /100 | #171 | Average 96.1% |
| Venezuelans | 51.4 /100 | #172 | Average 96.0% |