Inupiat vs Central American Indian 9th Grade
COMPARE
Inupiat
Central American Indian
9th Grade
9th Grade Comparison
Inupiat
Central American Indians
95.8%
9TH GRADE
99.5/ 100
METRIC RATING
75th/ 347
METRIC RANK
91.5%
9TH GRADE
0.0/ 100
METRIC RATING
325th/ 347
METRIC RANK
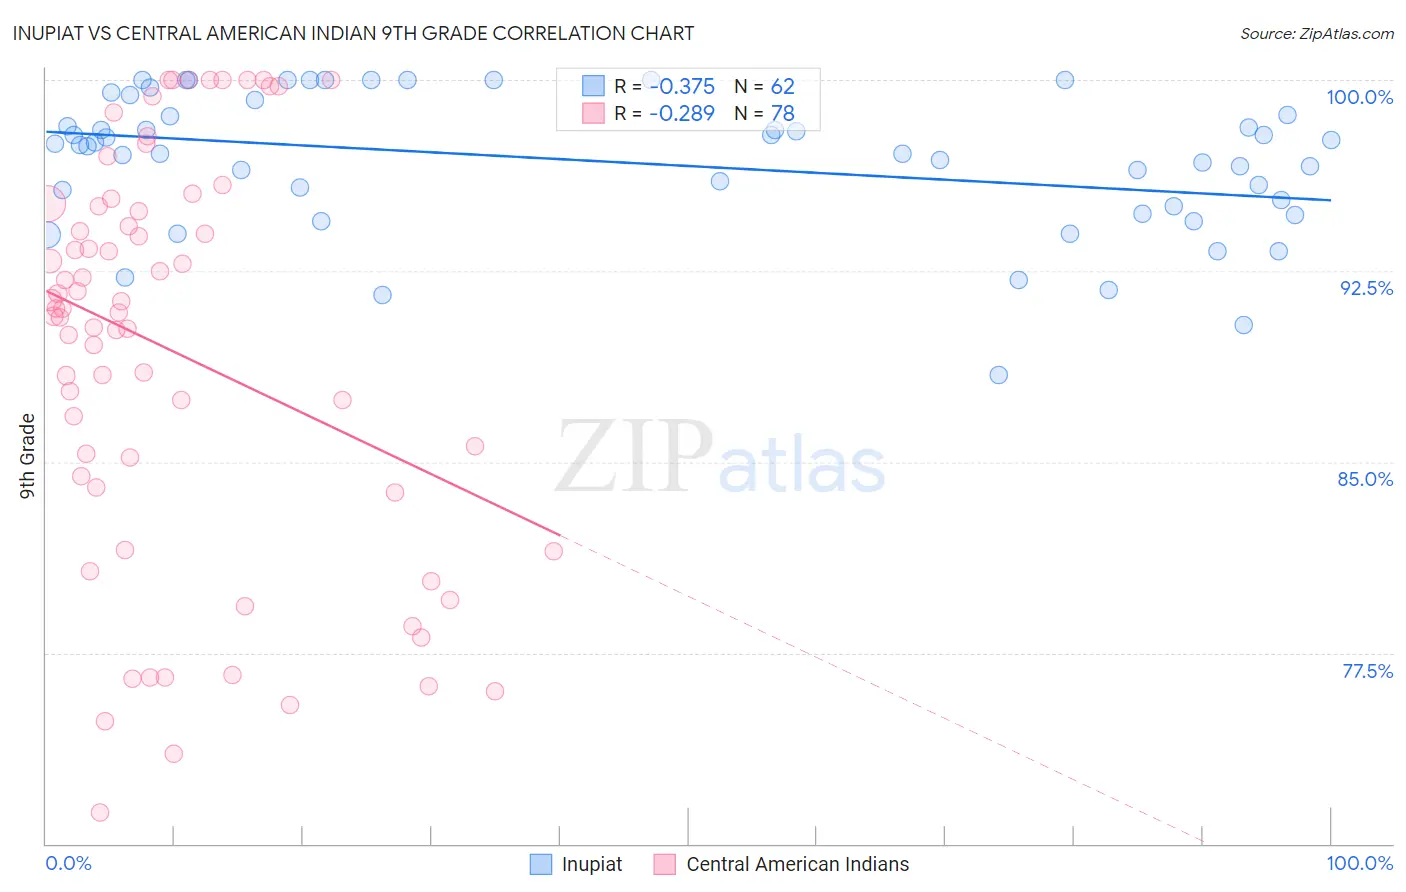
Inupiat vs Central American Indian 9th Grade Correlation Chart
The statistical analysis conducted on geographies consisting of 96,349,180 people shows a mild negative correlation between the proportion of Inupiat and percentage of population with at least 9th grade education in the United States with a correlation coefficient (R) of -0.375 and weighted average of 95.8%. Similarly, the statistical analysis conducted on geographies consisting of 326,142,359 people shows a weak negative correlation between the proportion of Central American Indians and percentage of population with at least 9th grade education in the United States with a correlation coefficient (R) of -0.289 and weighted average of 91.5%, a difference of 4.7%.
9th Grade Correlation Summary
| Measurement | Inupiat | Central American Indian |
| Minimum | 88.4% | 71.2% |
| Maximum | 100.0% | 100.0% |
| Range | 11.6% | 28.8% |
| Mean | 96.8% | 89.3% |
| Median | 97.4% | 90.9% |
| Interquartile 25% (IQ1) | 95.0% | 84.0% |
| Interquartile 75% (IQ3) | 98.6% | 95.1% |
| Interquartile Range (IQR) | 3.6% | 11.1% |
| Standard Deviation (Sample) | 2.7% | 7.9% |
| Standard Deviation (Population) | 2.7% | 7.8% |
Similar Demographics by 9th Grade
Demographics Similar to Inupiat by 9th Grade
In terms of 9th grade, the demographic groups most similar to Inupiat are Thai (95.8%, a difference of 0.010%), Immigrants from Sweden (95.8%, a difference of 0.010%), White/Caucasian (95.8%, a difference of 0.010%), Immigrants from South Africa (95.8%, a difference of 0.010%), and Immigrants from Belgium (95.8%, a difference of 0.020%).
| Demographics | Rating | Rank | 9th Grade |
| Immigrants | Ireland | 99.6 /100 | #68 | Exceptional 95.8% |
| Immigrants | Lithuania | 99.6 /100 | #69 | Exceptional 95.8% |
| Immigrants | Australia | 99.5 /100 | #70 | Exceptional 95.8% |
| Immigrants | Belgium | 99.5 /100 | #71 | Exceptional 95.8% |
| Turks | 99.5 /100 | #72 | Exceptional 95.8% |
| Immigrants | Singapore | 99.5 /100 | #73 | Exceptional 95.8% |
| Thais | 99.5 /100 | #74 | Exceptional 95.8% |
| Inupiat | 99.5 /100 | #75 | Exceptional 95.8% |
| Immigrants | Sweden | 99.5 /100 | #76 | Exceptional 95.8% |
| Whites/Caucasians | 99.4 /100 | #77 | Exceptional 95.8% |
| Immigrants | South Africa | 99.4 /100 | #78 | Exceptional 95.8% |
| Romanians | 99.3 /100 | #79 | Exceptional 95.7% |
| Bhutanese | 99.3 /100 | #80 | Exceptional 95.7% |
| Arapaho | 99.3 /100 | #81 | Exceptional 95.7% |
| Puget Sound Salish | 99.2 /100 | #82 | Exceptional 95.7% |
Demographics Similar to Central American Indians by 9th Grade
In terms of 9th grade, the demographic groups most similar to Central American Indians are Immigrants from Armenia (91.4%, a difference of 0.10%), Immigrants from Nicaragua (91.3%, a difference of 0.15%), Immigrants from Belize (91.8%, a difference of 0.33%), Belizean (91.8%, a difference of 0.39%), and Puerto Rican (91.8%, a difference of 0.39%).
| Demographics | Rating | Rank | 9th Grade |
| Nepalese | 0.0 /100 | #318 | Tragic 92.0% |
| Ecuadorians | 0.0 /100 | #319 | Tragic 91.9% |
| Nicaraguans | 0.0 /100 | #320 | Tragic 91.9% |
| Immigrants | Ecuador | 0.0 /100 | #321 | Tragic 91.8% |
| Belizeans | 0.0 /100 | #322 | Tragic 91.8% |
| Puerto Ricans | 0.0 /100 | #323 | Tragic 91.8% |
| Immigrants | Belize | 0.0 /100 | #324 | Tragic 91.8% |
| Central American Indians | 0.0 /100 | #325 | Tragic 91.5% |
| Immigrants | Armenia | 0.0 /100 | #326 | Tragic 91.4% |
| Immigrants | Nicaragua | 0.0 /100 | #327 | Tragic 91.3% |
| Dominicans | 0.0 /100 | #328 | Tragic 91.1% |
| Hondurans | 0.0 /100 | #329 | Tragic 91.0% |
| Immigrants | Cabo Verde | 0.0 /100 | #330 | Tragic 90.9% |
| Mexican American Indians | 0.0 /100 | #331 | Tragic 90.9% |
| Hispanics or Latinos | 0.0 /100 | #332 | Tragic 90.9% |