Panamanian vs Central American Indian 9th Grade
COMPARE
Panamanian
Central American Indian
9th Grade
9th Grade Comparison
Panamanians
Central American Indians
94.7%
9TH GRADE
29.0/ 100
METRIC RATING
194th/ 347
METRIC RANK
91.5%
9TH GRADE
0.0/ 100
METRIC RATING
325th/ 347
METRIC RANK
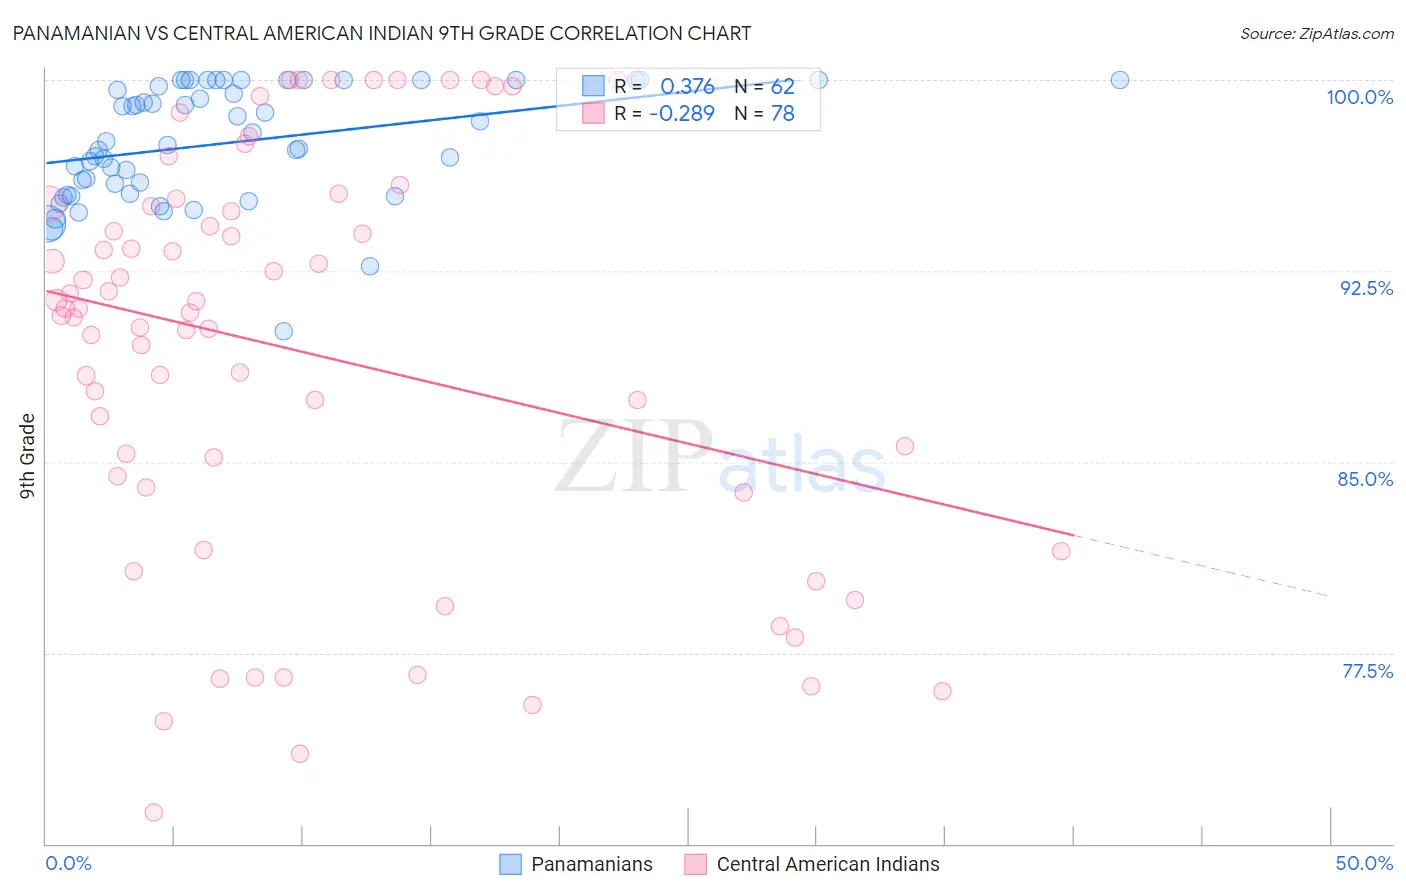
Panamanian vs Central American Indian 9th Grade Correlation Chart
The statistical analysis conducted on geographies consisting of 281,248,945 people shows a mild positive correlation between the proportion of Panamanians and percentage of population with at least 9th grade education in the United States with a correlation coefficient (R) of 0.376 and weighted average of 94.7%. Similarly, the statistical analysis conducted on geographies consisting of 326,142,359 people shows a weak negative correlation between the proportion of Central American Indians and percentage of population with at least 9th grade education in the United States with a correlation coefficient (R) of -0.289 and weighted average of 91.5%, a difference of 3.6%.
9th Grade Correlation Summary
| Measurement | Panamanian | Central American Indian |
| Minimum | 90.1% | 71.2% |
| Maximum | 100.0% | 100.0% |
| Range | 9.9% | 28.8% |
| Mean | 97.5% | 89.3% |
| Median | 97.5% | 90.9% |
| Interquartile 25% (IQ1) | 95.5% | 84.0% |
| Interquartile 75% (IQ3) | 100.0% | 95.1% |
| Interquartile Range (IQR) | 4.5% | 11.1% |
| Standard Deviation (Sample) | 2.3% | 7.9% |
| Standard Deviation (Population) | 2.2% | 7.8% |
Similar Demographics by 9th Grade
Demographics Similar to Panamanians by 9th Grade
In terms of 9th grade, the demographic groups most similar to Panamanians are Immigrants from Northern Africa (94.7%, a difference of 0.010%), Paraguayan (94.7%, a difference of 0.010%), Marshallese (94.7%, a difference of 0.010%), Immigrants from Lebanon (94.7%, a difference of 0.020%), and Sudanese (94.7%, a difference of 0.030%).
| Demographics | Rating | Rank | 9th Grade |
| Guamanians/Chamorros | 35.5 /100 | #187 | Fair 94.8% |
| Immigrants | Albania | 34.5 /100 | #188 | Fair 94.8% |
| Immigrants | Argentina | 34.4 /100 | #189 | Fair 94.8% |
| Sudanese | 32.7 /100 | #190 | Fair 94.7% |
| Assyrians/Chaldeans/Syriacs | 32.0 /100 | #191 | Fair 94.7% |
| Immigrants | Northern Africa | 30.7 /100 | #192 | Fair 94.7% |
| Paraguayans | 30.1 /100 | #193 | Fair 94.7% |
| Panamanians | 29.0 /100 | #194 | Fair 94.7% |
| Marshallese | 27.9 /100 | #195 | Fair 94.7% |
| Immigrants | Lebanon | 27.2 /100 | #196 | Fair 94.7% |
| Immigrants | Micronesia | 24.7 /100 | #197 | Fair 94.7% |
| Hawaiians | 22.7 /100 | #198 | Fair 94.7% |
| Laotians | 21.0 /100 | #199 | Fair 94.6% |
| Immigrants | Zaire | 20.6 /100 | #200 | Fair 94.6% |
| Blacks/African Americans | 20.5 /100 | #201 | Fair 94.6% |
Demographics Similar to Central American Indians by 9th Grade
In terms of 9th grade, the demographic groups most similar to Central American Indians are Immigrants from Armenia (91.4%, a difference of 0.10%), Immigrants from Nicaragua (91.3%, a difference of 0.15%), Immigrants from Belize (91.8%, a difference of 0.33%), Belizean (91.8%, a difference of 0.39%), and Puerto Rican (91.8%, a difference of 0.39%).
| Demographics | Rating | Rank | 9th Grade |
| Nepalese | 0.0 /100 | #318 | Tragic 92.0% |
| Ecuadorians | 0.0 /100 | #319 | Tragic 91.9% |
| Nicaraguans | 0.0 /100 | #320 | Tragic 91.9% |
| Immigrants | Ecuador | 0.0 /100 | #321 | Tragic 91.8% |
| Belizeans | 0.0 /100 | #322 | Tragic 91.8% |
| Puerto Ricans | 0.0 /100 | #323 | Tragic 91.8% |
| Immigrants | Belize | 0.0 /100 | #324 | Tragic 91.8% |
| Central American Indians | 0.0 /100 | #325 | Tragic 91.5% |
| Immigrants | Armenia | 0.0 /100 | #326 | Tragic 91.4% |
| Immigrants | Nicaragua | 0.0 /100 | #327 | Tragic 91.3% |
| Dominicans | 0.0 /100 | #328 | Tragic 91.1% |
| Hondurans | 0.0 /100 | #329 | Tragic 91.0% |
| Immigrants | Cabo Verde | 0.0 /100 | #330 | Tragic 90.9% |
| Mexican American Indians | 0.0 /100 | #331 | Tragic 90.9% |
| Hispanics or Latinos | 0.0 /100 | #332 | Tragic 90.9% |