South African vs Central American Indian 9th Grade
COMPARE
South African
Central American Indian
9th Grade
9th Grade Comparison
South Africans
Central American Indians
95.6%
9TH GRADE
98.8/ 100
METRIC RATING
90th/ 347
METRIC RANK
91.5%
9TH GRADE
0.0/ 100
METRIC RATING
325th/ 347
METRIC RANK
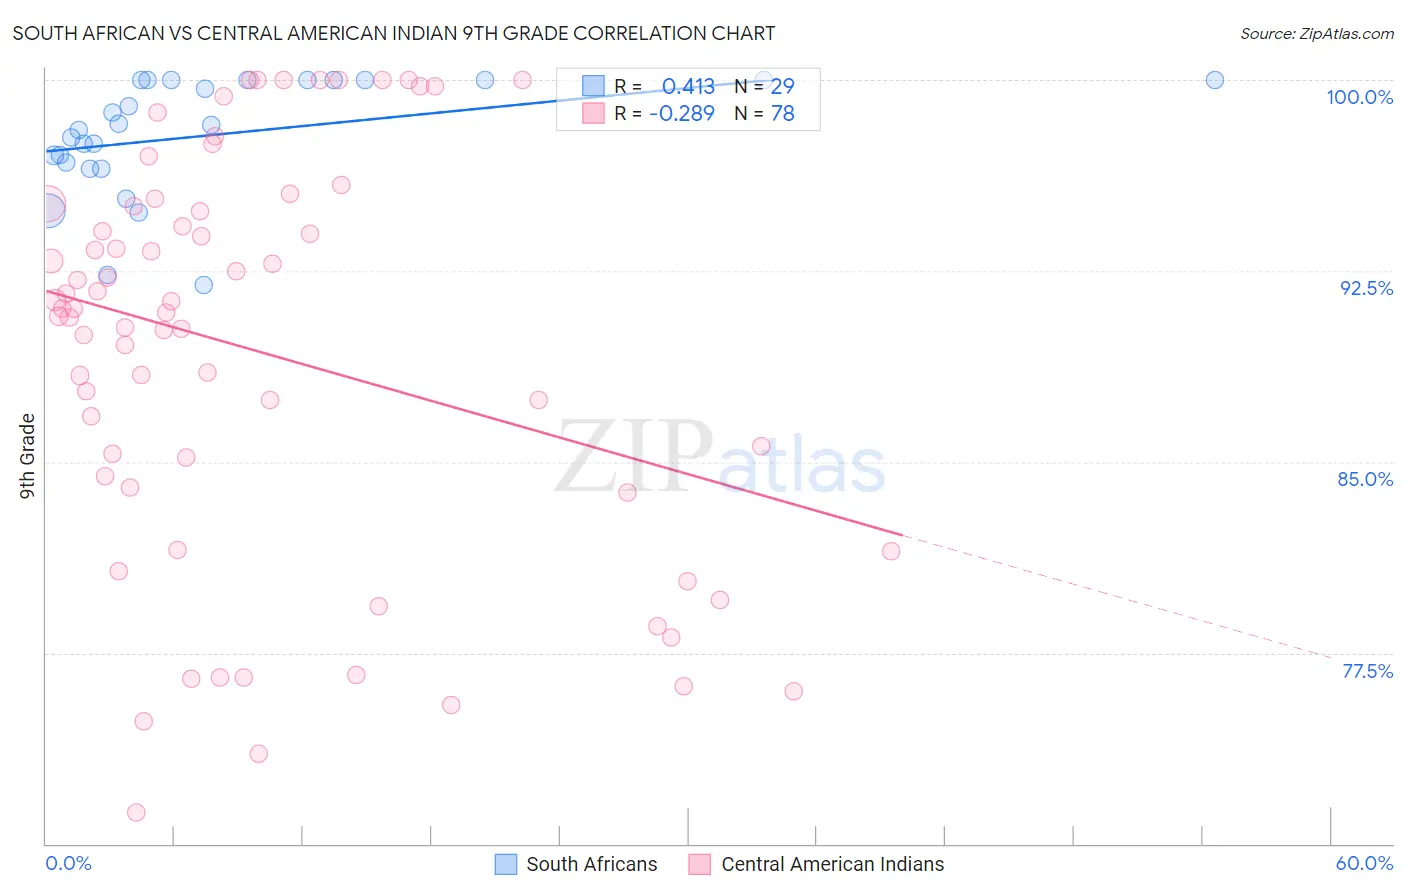
South African vs Central American Indian 9th Grade Correlation Chart
The statistical analysis conducted on geographies consisting of 182,604,532 people shows a moderate positive correlation between the proportion of South Africans and percentage of population with at least 9th grade education in the United States with a correlation coefficient (R) of 0.413 and weighted average of 95.6%. Similarly, the statistical analysis conducted on geographies consisting of 326,142,359 people shows a weak negative correlation between the proportion of Central American Indians and percentage of population with at least 9th grade education in the United States with a correlation coefficient (R) of -0.289 and weighted average of 91.5%, a difference of 4.6%.
9th Grade Correlation Summary
| Measurement | South African | Central American Indian |
| Minimum | 91.9% | 71.2% |
| Maximum | 100.0% | 100.0% |
| Range | 8.1% | 28.8% |
| Mean | 97.9% | 89.3% |
| Median | 98.2% | 90.9% |
| Interquartile 25% (IQ1) | 96.6% | 84.0% |
| Interquartile 75% (IQ3) | 100.0% | 95.1% |
| Interquartile Range (IQR) | 3.4% | 11.1% |
| Standard Deviation (Sample) | 2.3% | 7.9% |
| Standard Deviation (Population) | 2.3% | 7.8% |
Similar Demographics by 9th Grade
Demographics Similar to South Africans by 9th Grade
In terms of 9th grade, the demographic groups most similar to South Africans are Immigrants from Czechoslovakia (95.7%, a difference of 0.010%), Yugoslavian (95.7%, a difference of 0.010%), Creek (95.6%, a difference of 0.010%), Immigrants from Saudi Arabia (95.6%, a difference of 0.010%), and Okinawan (95.7%, a difference of 0.020%).
| Demographics | Rating | Rank | 9th Grade |
| Swiss | 99.2 /100 | #83 | Exceptional 95.7% |
| Immigrants | Denmark | 99.1 /100 | #84 | Exceptional 95.7% |
| Icelanders | 99.1 /100 | #85 | Exceptional 95.7% |
| Immigrants | Western Europe | 99.1 /100 | #86 | Exceptional 95.7% |
| Okinawans | 99.0 /100 | #87 | Exceptional 95.7% |
| Immigrants | Czechoslovakia | 98.9 /100 | #88 | Exceptional 95.7% |
| Yugoslavians | 98.9 /100 | #89 | Exceptional 95.7% |
| South Africans | 98.8 /100 | #90 | Exceptional 95.6% |
| Creek | 98.8 /100 | #91 | Exceptional 95.6% |
| Immigrants | Saudi Arabia | 98.8 /100 | #92 | Exceptional 95.6% |
| Immigrants | Germany | 98.7 /100 | #93 | Exceptional 95.6% |
| Immigrants | Latvia | 98.7 /100 | #94 | Exceptional 95.6% |
| Americans | 98.5 /100 | #95 | Exceptional 95.6% |
| Filipinos | 98.5 /100 | #96 | Exceptional 95.6% |
| Delaware | 98.4 /100 | #97 | Exceptional 95.6% |
Demographics Similar to Central American Indians by 9th Grade
In terms of 9th grade, the demographic groups most similar to Central American Indians are Immigrants from Armenia (91.4%, a difference of 0.10%), Immigrants from Nicaragua (91.3%, a difference of 0.15%), Immigrants from Belize (91.8%, a difference of 0.33%), Belizean (91.8%, a difference of 0.39%), and Puerto Rican (91.8%, a difference of 0.39%).
| Demographics | Rating | Rank | 9th Grade |
| Nepalese | 0.0 /100 | #318 | Tragic 92.0% |
| Ecuadorians | 0.0 /100 | #319 | Tragic 91.9% |
| Nicaraguans | 0.0 /100 | #320 | Tragic 91.9% |
| Immigrants | Ecuador | 0.0 /100 | #321 | Tragic 91.8% |
| Belizeans | 0.0 /100 | #322 | Tragic 91.8% |
| Puerto Ricans | 0.0 /100 | #323 | Tragic 91.8% |
| Immigrants | Belize | 0.0 /100 | #324 | Tragic 91.8% |
| Central American Indians | 0.0 /100 | #325 | Tragic 91.5% |
| Immigrants | Armenia | 0.0 /100 | #326 | Tragic 91.4% |
| Immigrants | Nicaragua | 0.0 /100 | #327 | Tragic 91.3% |
| Dominicans | 0.0 /100 | #328 | Tragic 91.1% |
| Hondurans | 0.0 /100 | #329 | Tragic 91.0% |
| Immigrants | Cabo Verde | 0.0 /100 | #330 | Tragic 90.9% |
| Mexican American Indians | 0.0 /100 | #331 | Tragic 90.9% |
| Hispanics or Latinos | 0.0 /100 | #332 | Tragic 90.9% |