Guatemalan vs Central American Indian 9th Grade
COMPARE
Guatemalan
Central American Indian
9th Grade
9th Grade Comparison
Guatemalans
Central American Indians
89.9%
9TH GRADE
0.0/ 100
METRIC RATING
341st/ 347
METRIC RANK
91.5%
9TH GRADE
0.0/ 100
METRIC RATING
325th/ 347
METRIC RANK
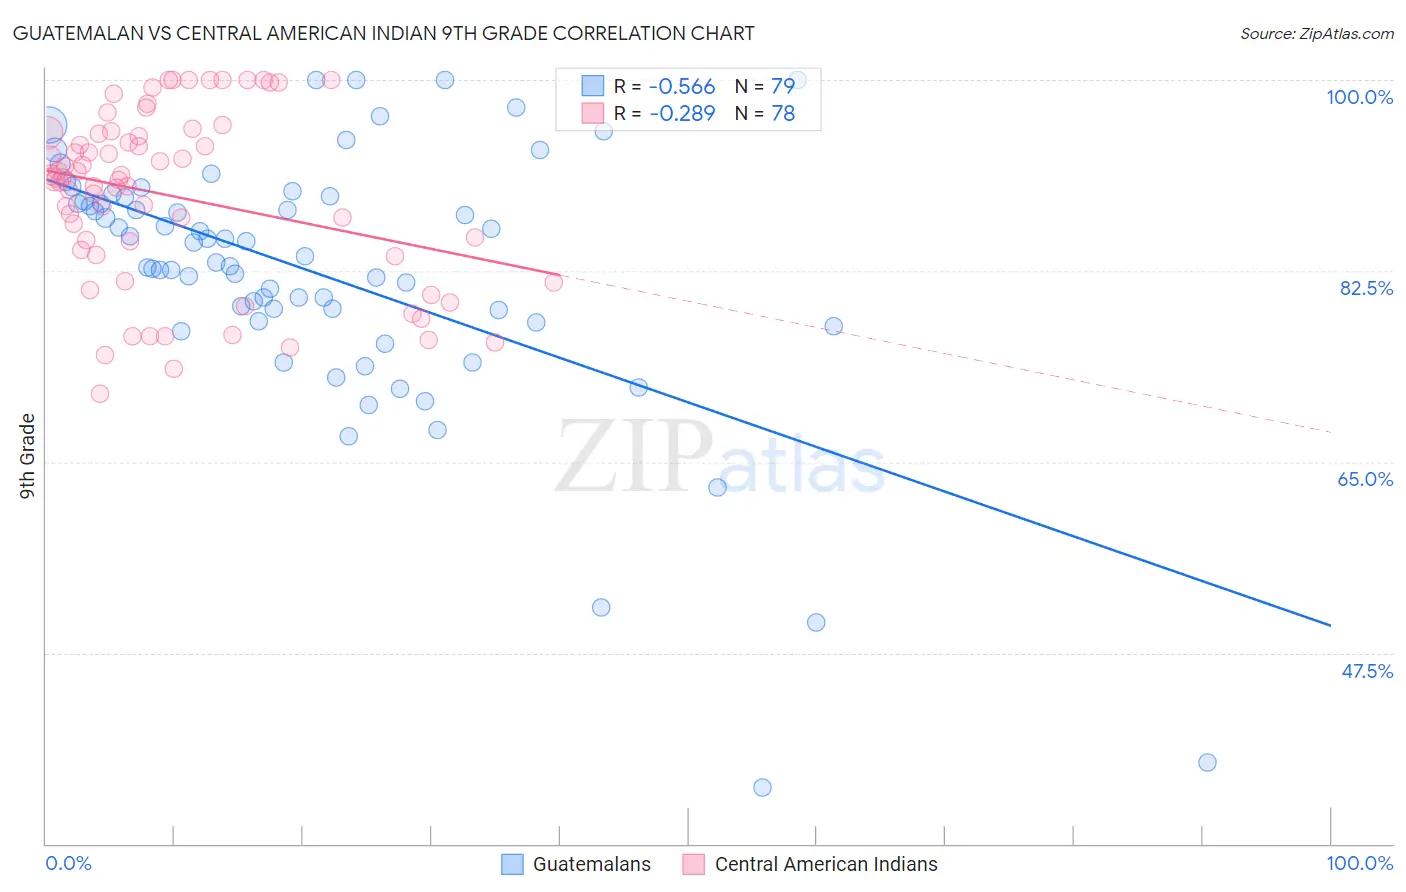
Guatemalan vs Central American Indian 9th Grade Correlation Chart
The statistical analysis conducted on geographies consisting of 409,566,618 people shows a substantial negative correlation between the proportion of Guatemalans and percentage of population with at least 9th grade education in the United States with a correlation coefficient (R) of -0.566 and weighted average of 89.9%. Similarly, the statistical analysis conducted on geographies consisting of 326,142,359 people shows a weak negative correlation between the proportion of Central American Indians and percentage of population with at least 9th grade education in the United States with a correlation coefficient (R) of -0.289 and weighted average of 91.5%, a difference of 1.8%.
9th Grade Correlation Summary
| Measurement | Guatemalan | Central American Indian |
| Minimum | 35.2% | 71.2% |
| Maximum | 100.0% | 100.0% |
| Range | 64.8% | 28.8% |
| Mean | 82.2% | 89.3% |
| Median | 83.9% | 90.9% |
| Interquartile 25% (IQ1) | 77.9% | 84.0% |
| Interquartile 75% (IQ3) | 89.2% | 95.1% |
| Interquartile Range (IQR) | 11.3% | 11.1% |
| Standard Deviation (Sample) | 12.1% | 7.9% |
| Standard Deviation (Population) | 12.1% | 7.8% |
Demographics Similar to Guatemalans and Central American Indians by 9th Grade
In terms of 9th grade, the demographic groups most similar to Guatemalans are Mexican (90.0%, a difference of 0.13%), Yakama (90.1%, a difference of 0.19%), Salvadoran (89.6%, a difference of 0.31%), Immigrants from Guatemala (89.4%, a difference of 0.51%), and Central American (90.4%, a difference of 0.52%). Similarly, the demographic groups most similar to Central American Indians are Immigrants from Armenia (91.4%, a difference of 0.10%), Immigrants from Nicaragua (91.3%, a difference of 0.15%), Immigrants from Belize (91.8%, a difference of 0.33%), Puerto Rican (91.8%, a difference of 0.39%), and Dominican (91.1%, a difference of 0.44%).
| Demographics | Rating | Rank | 9th Grade |
| Puerto Ricans | 0.0 /100 | #323 | Tragic 91.8% |
| Immigrants | Belize | 0.0 /100 | #324 | Tragic 91.8% |
| Central American Indians | 0.0 /100 | #325 | Tragic 91.5% |
| Immigrants | Armenia | 0.0 /100 | #326 | Tragic 91.4% |
| Immigrants | Nicaragua | 0.0 /100 | #327 | Tragic 91.3% |
| Dominicans | 0.0 /100 | #328 | Tragic 91.1% |
| Hondurans | 0.0 /100 | #329 | Tragic 91.0% |
| Immigrants | Cabo Verde | 0.0 /100 | #330 | Tragic 90.9% |
| Mexican American Indians | 0.0 /100 | #331 | Tragic 90.9% |
| Hispanics or Latinos | 0.0 /100 | #332 | Tragic 90.9% |
| Immigrants | Yemen | 0.0 /100 | #333 | Tragic 90.8% |
| Immigrants | Azores | 0.0 /100 | #334 | Tragic 90.8% |
| Immigrants | Honduras | 0.0 /100 | #335 | Tragic 90.6% |
| Immigrants | Dominican Republic | 0.0 /100 | #336 | Tragic 90.5% |
| Immigrants | Latin America | 0.0 /100 | #337 | Tragic 90.4% |
| Central Americans | 0.0 /100 | #338 | Tragic 90.4% |
| Yakama | 0.0 /100 | #339 | Tragic 90.1% |
| Mexicans | 0.0 /100 | #340 | Tragic 90.0% |
| Guatemalans | 0.0 /100 | #341 | Tragic 89.9% |
| Salvadorans | 0.0 /100 | #342 | Tragic 89.6% |
| Immigrants | Guatemala | 0.0 /100 | #343 | Tragic 89.4% |