Inupiat vs Central American Indian 3rd Grade
COMPARE
Inupiat
Central American Indian
3rd Grade
3rd Grade Comparison
Inupiat
Central American Indians
98.8%
3RD GRADE
100.0/ 100
METRIC RATING
4th/ 347
METRIC RANK
96.7%
3RD GRADE
0.0/ 100
METRIC RATING
305th/ 347
METRIC RANK
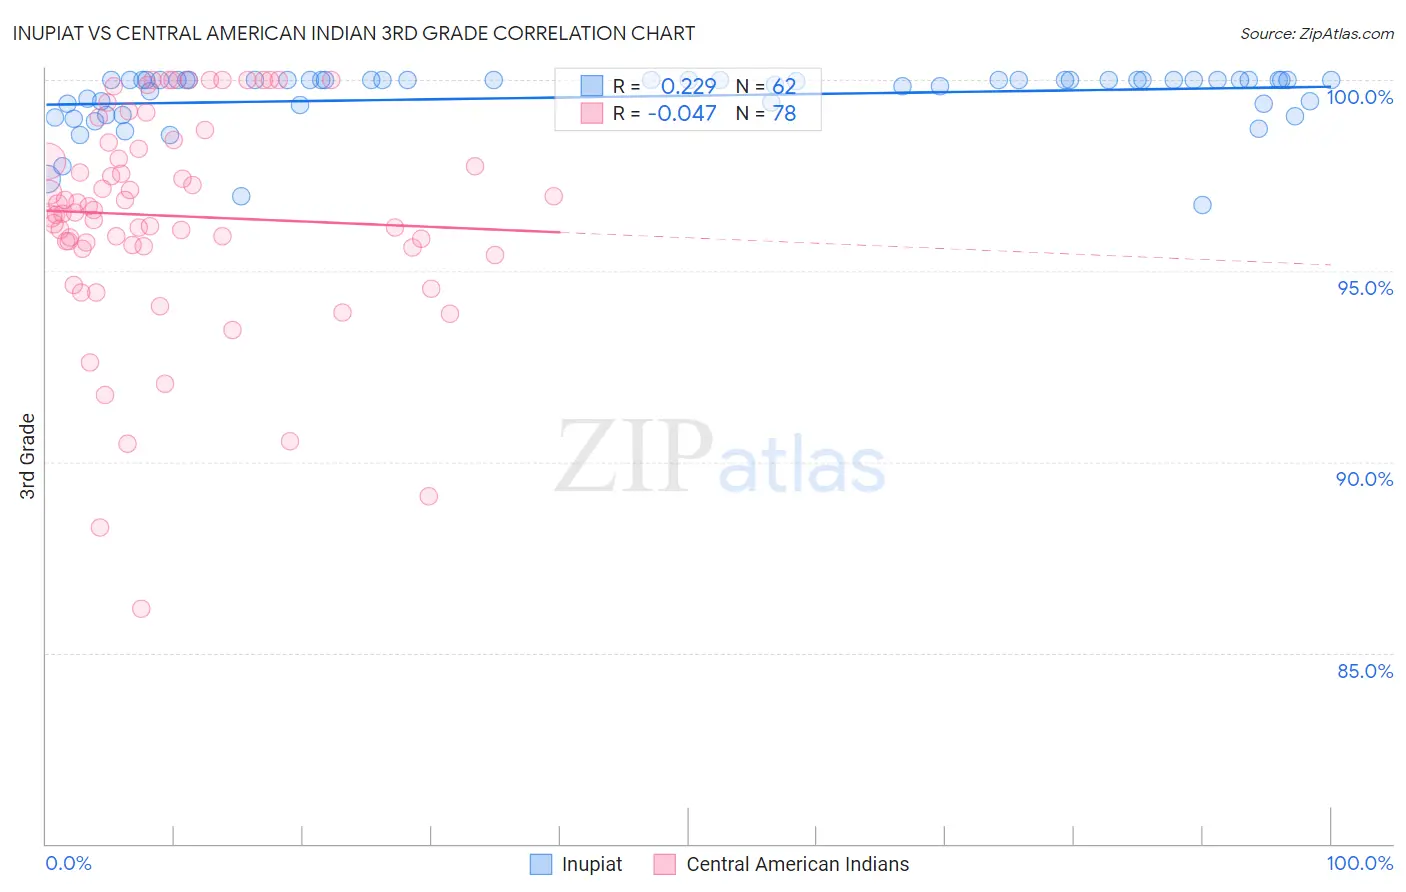
Inupiat vs Central American Indian 3rd Grade Correlation Chart
The statistical analysis conducted on geographies consisting of 96,348,974 people shows a weak positive correlation between the proportion of Inupiat and percentage of population with at least 3rd grade education in the United States with a correlation coefficient (R) of 0.229 and weighted average of 98.8%. Similarly, the statistical analysis conducted on geographies consisting of 326,141,205 people shows no correlation between the proportion of Central American Indians and percentage of population with at least 3rd grade education in the United States with a correlation coefficient (R) of -0.047 and weighted average of 96.7%, a difference of 2.1%.
3rd Grade Correlation Summary
| Measurement | Inupiat | Central American Indian |
| Minimum | 96.7% | 86.2% |
| Maximum | 100.0% | 100.0% |
| Range | 3.3% | 13.8% |
| Mean | 99.6% | 96.4% |
| Median | 100.0% | 96.6% |
| Interquartile 25% (IQ1) | 99.4% | 95.6% |
| Interquartile 75% (IQ3) | 100.0% | 98.4% |
| Interquartile Range (IQR) | 0.62% | 2.7% |
| Standard Deviation (Sample) | 0.76% | 2.8% |
| Standard Deviation (Population) | 0.76% | 2.8% |
Similar Demographics by 3rd Grade
Demographics Similar to Inupiat by 3rd Grade
In terms of 3rd grade, the demographic groups most similar to Inupiat are Tsimshian (98.8%, a difference of 0.010%), Welsh (98.8%, a difference of 0.030%), Alaskan Athabascan (98.7%, a difference of 0.11%), Norwegian (98.6%, a difference of 0.15%), and Slovak (98.6%, a difference of 0.16%).
| Demographics | Rating | Rank | 3rd Grade |
| Crow | 100.0 /100 | #1 | Exceptional 99.6% |
| Yup'ik | 100.0 /100 | #2 | Exceptional 99.0% |
| Welsh | 100.0 /100 | #3 | Exceptional 98.8% |
| Inupiat | 100.0 /100 | #4 | Exceptional 98.8% |
| Tsimshian | 100.0 /100 | #5 | Exceptional 98.8% |
| Alaskan Athabascans | 100.0 /100 | #6 | Exceptional 98.7% |
| Norwegians | 100.0 /100 | #7 | Exceptional 98.6% |
| Slovaks | 100.0 /100 | #8 | Exceptional 98.6% |
| Germans | 100.0 /100 | #9 | Exceptional 98.6% |
| Alaska Natives | 100.0 /100 | #10 | Exceptional 98.6% |
| Slovenes | 100.0 /100 | #11 | Exceptional 98.6% |
| English | 100.0 /100 | #12 | Exceptional 98.6% |
| Tlingit-Haida | 100.0 /100 | #13 | Exceptional 98.5% |
| Carpatho Rusyns | 100.0 /100 | #14 | Exceptional 98.5% |
| Swedes | 100.0 /100 | #15 | Exceptional 98.5% |
Demographics Similar to Central American Indians by 3rd Grade
In terms of 3rd grade, the demographic groups most similar to Central American Indians are Immigrants from Caribbean (96.7%, a difference of 0.010%), Immigrants from Somalia (96.8%, a difference of 0.030%), Ecuadorian (96.7%, a difference of 0.030%), Guyanese (96.7%, a difference of 0.030%), and Nicaraguan (96.7%, a difference of 0.050%).
| Demographics | Rating | Rank | 3rd Grade |
| Immigrants | Dominica | 0.0 /100 | #298 | Tragic 96.9% |
| Somalis | 0.0 /100 | #299 | Tragic 96.8% |
| Immigrants | South Eastern Asia | 0.0 /100 | #300 | Tragic 96.8% |
| Immigrants | Cuba | 0.0 /100 | #301 | Tragic 96.8% |
| Immigrants | Somalia | 0.0 /100 | #302 | Tragic 96.8% |
| Ecuadorians | 0.0 /100 | #303 | Tragic 96.7% |
| Immigrants | Caribbean | 0.0 /100 | #304 | Tragic 96.7% |
| Central American Indians | 0.0 /100 | #305 | Tragic 96.7% |
| Guyanese | 0.0 /100 | #306 | Tragic 96.7% |
| Nicaraguans | 0.0 /100 | #307 | Tragic 96.7% |
| Immigrants | Haiti | 0.0 /100 | #308 | Tragic 96.7% |
| Sri Lankans | 0.0 /100 | #309 | Tragic 96.7% |
| Cape Verdeans | 0.0 /100 | #310 | Tragic 96.6% |
| Immigrants | Guyana | 0.0 /100 | #311 | Tragic 96.6% |
| Immigrants | Laos | 0.0 /100 | #312 | Tragic 96.6% |