New Zealander vs Soviet Union Bachelor's Degree
COMPARE
New Zealander
Soviet Union
Bachelor's Degree
Bachelor's Degree Comparison
New Zealanders
Soviet Union
44.0%
BACHELOR'S DEGREE
99.9/ 100
METRIC RATING
60th/ 347
METRIC RANK
47.9%
BACHELOR'S DEGREE
100.0/ 100
METRIC RATING
16th/ 347
METRIC RANK
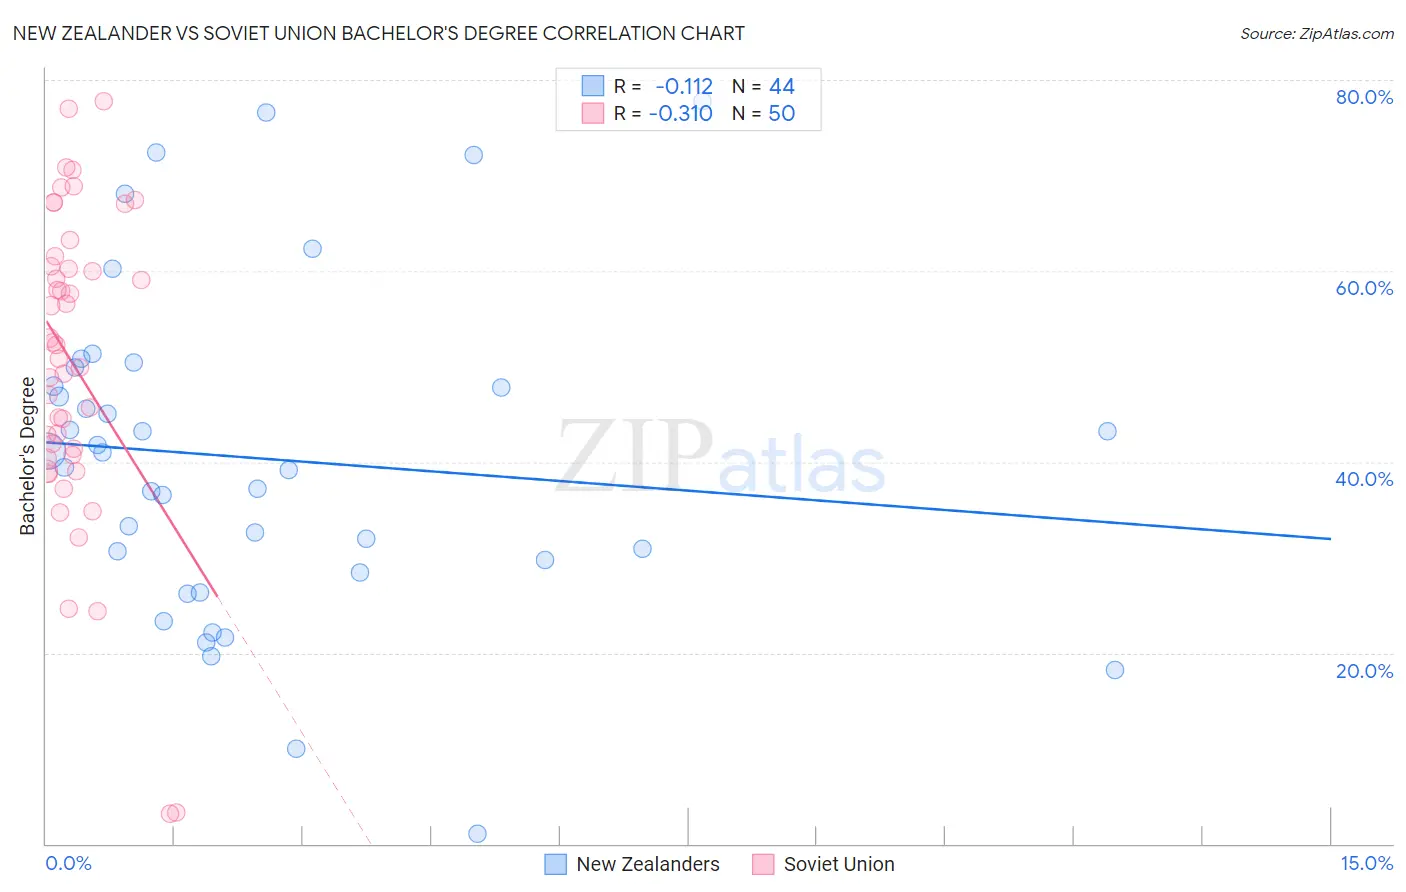
New Zealander vs Soviet Union Bachelor's Degree Correlation Chart
The statistical analysis conducted on geographies consisting of 106,915,831 people shows a poor negative correlation between the proportion of New Zealanders and percentage of population with at least bachelor's degree education in the United States with a correlation coefficient (R) of -0.112 and weighted average of 44.0%. Similarly, the statistical analysis conducted on geographies consisting of 43,514,626 people shows a mild negative correlation between the proportion of Soviet Union and percentage of population with at least bachelor's degree education in the United States with a correlation coefficient (R) of -0.310 and weighted average of 47.9%, a difference of 9.0%.
Bachelor's Degree Correlation Summary
| Measurement | New Zealander | Soviet Union |
| Minimum | 1.0% | 3.1% |
| Maximum | 77.8% | 77.7% |
| Range | 76.8% | 74.6% |
| Mean | 40.3% | 50.2% |
| Median | 40.2% | 51.5% |
| Interquartile 25% (IQ1) | 29.1% | 40.7% |
| Interquartile 75% (IQ3) | 48.9% | 60.5% |
| Interquartile Range (IQR) | 19.8% | 19.8% |
| Standard Deviation (Sample) | 17.3% | 16.2% |
| Standard Deviation (Population) | 17.1% | 16.0% |
Similar Demographics by Bachelor's Degree
Demographics Similar to New Zealanders by Bachelor's Degree
In terms of bachelor's degree, the demographic groups most similar to New Zealanders are Australian (44.0%, a difference of 0.010%), Immigrants from Czechoslovakia (44.0%, a difference of 0.11%), Paraguayan (44.0%, a difference of 0.16%), Immigrants from Serbia (44.1%, a difference of 0.35%), and Immigrants from Bolivia (44.2%, a difference of 0.53%).
| Demographics | Rating | Rank | Bachelor's Degree |
| Immigrants | Asia | 99.9 /100 | #53 | Exceptional 44.3% |
| Immigrants | Austria | 99.9 /100 | #54 | Exceptional 44.2% |
| Immigrants | Bolivia | 99.9 /100 | #55 | Exceptional 44.2% |
| Immigrants | Serbia | 99.9 /100 | #56 | Exceptional 44.1% |
| Paraguayans | 99.9 /100 | #57 | Exceptional 44.0% |
| Immigrants | Czechoslovakia | 99.9 /100 | #58 | Exceptional 44.0% |
| Australians | 99.9 /100 | #59 | Exceptional 44.0% |
| New Zealanders | 99.9 /100 | #60 | Exceptional 44.0% |
| South Africans | 99.8 /100 | #61 | Exceptional 43.6% |
| Immigrants | Kazakhstan | 99.8 /100 | #62 | Exceptional 43.4% |
| Immigrants | Europe | 99.8 /100 | #63 | Exceptional 43.4% |
| Argentineans | 99.7 /100 | #64 | Exceptional 43.3% |
| Zimbabweans | 99.7 /100 | #65 | Exceptional 43.3% |
| Immigrants | Netherlands | 99.7 /100 | #66 | Exceptional 43.3% |
| Egyptians | 99.7 /100 | #67 | Exceptional 43.3% |
Demographics Similar to Soviet Union by Bachelor's Degree
In terms of bachelor's degree, the demographic groups most similar to Soviet Union are Immigrants from Eastern Asia (48.1%, a difference of 0.46%), Immigrants from Hong Kong (48.2%, a difference of 0.60%), Eastern European (47.5%, a difference of 0.86%), Immigrants from South Central Asia (48.3%, a difference of 0.88%), and Indian (Asian) (47.4%, a difference of 1.0%).
| Demographics | Rating | Rank | Bachelor's Degree |
| Immigrants | Israel | 100.0 /100 | #9 | Exceptional 50.0% |
| Cypriots | 100.0 /100 | #10 | Exceptional 49.0% |
| Immigrants | Australia | 100.0 /100 | #11 | Exceptional 48.5% |
| Immigrants | China | 100.0 /100 | #12 | Exceptional 48.4% |
| Immigrants | South Central Asia | 100.0 /100 | #13 | Exceptional 48.3% |
| Immigrants | Hong Kong | 100.0 /100 | #14 | Exceptional 48.2% |
| Immigrants | Eastern Asia | 100.0 /100 | #15 | Exceptional 48.1% |
| Soviet Union | 100.0 /100 | #16 | Exceptional 47.9% |
| Eastern Europeans | 100.0 /100 | #17 | Exceptional 47.5% |
| Indians (Asian) | 100.0 /100 | #18 | Exceptional 47.4% |
| Cambodians | 100.0 /100 | #19 | Exceptional 47.2% |
| Immigrants | Switzerland | 100.0 /100 | #20 | Exceptional 47.1% |
| Immigrants | Ireland | 100.0 /100 | #21 | Exceptional 47.1% |
| Immigrants | Belgium | 100.0 /100 | #22 | Exceptional 47.0% |
| Immigrants | Sweden | 100.0 /100 | #23 | Exceptional 47.0% |