Indonesian vs Immigrants from Bolivia Bachelor's Degree

COMPARE

Indonesian
Race
Ancestry
AfghanAfricanAlaska NativeAlaskan AthabascanAlbanianAleutAlsatianAmericanApacheArabArapahoArgentineanArmenianAssyrian/Chaldean/SyriacAustralianAustrianBahamianBangladeshiBarbadianBasqueBelgianBelizeanBermudanBhutaneseBlackfeetBolivianBrazilianBritishBritish West IndianBulgarianBurmeseCajunCambodianCanadianCape VerdeanCarpatho RusynCelticCentral AmericanCentral American IndianCherokeeCheyenneChickasawChileanChineseChippewaChoctawColombianColvilleComancheCosta RicanCreeCreekCroatianCrowCubanCypriotCzechCzechoslovakianDanishDelawareDominicanDutchDutch West IndianEastern EuropeanEcuadorianEgyptianEnglishEstonianEthiopianEuropeanFijianFilipinoFinnishFrenchFrench American IndianFrench CanadianGermanGerman RussianGhanaianGreekGuamanian/ChamorroGuatemalanGuyaneseHaitianHmongHonduranHopiHoumaHungarianIcelanderIndian (Asian)IndonesianInupiatIranianIraqiIrishIroquoisIsraeliItalianJamaicanJapaneseJordanianKenyanKiowaKoreanLaotianLatvianLebaneseLiberianLithuanianLumbeeLuxembourgerMacedonianMalaysianMalteseMarshalleseMenomineeMexicanMexican American IndianMongolianMoroccanNative HawaiianNavajoNepaleseNew ZealanderNicaraguanNigerianNorthern EuropeanNorwegianOkinawanOsageOttawaPaiutePakistaniPalestinianPanamanianParaguayanPennsylvania GermanPeruvianPimaPolishPortuguesePotawatomiPuebloPuerto RicanPuget Sound SalishRomanianRussianSalvadoranSamoanScandinavianScotch-IrishScottishSeminoleSenegaleseSerbianShoshoneSierra LeoneanSiouxSlavicSlovakSloveneSomaliSouth AfricanSouth AmericanSouth American IndianSoviet UnionSpaniardSpanishSpanish AmericanSpanish American IndianSri LankanSubsaharan AfricanSudaneseSwedishSwissSyrianTaiwaneseThaiTlingit-HaidaTohono O'OdhamTonganTrinidadian and TobagonianTsimshianTurkishU.S. Virgin IslanderUgandanUkrainianUruguayanUteVenezuelanVietnameseWelshWest IndianYakamaYaquiYugoslavianYumanYup'ikZimbabwean
Immigration
NonimmigrantsImmigrantsAfghanistanAfricaAlbaniaArgentinaArmeniaAsiaAustraliaAustriaBahamasBangladeshBarbadosBelarusBelgiumBelizeBosnia and HerzegovinaBrazilBulgariaBurma/MyanmarCabo VerdeCambodiaCameroonCanadaCaribbeanCentral AmericaChileChinaColombiaCongoCosta RicaCroatiaCubaCzechoslovakiaDenmarkDominicaDominican RepublicEastern AfricaEastern AsiaEastern EuropeEcuadorEgyptEl SalvadorEnglandEritreaEthiopiaEuropeFijiFranceGermanyGhanaGreeceGrenadaGuatemalaGuyanaHaitiHondurasHong KongHungaryIndiaIndonesiaIranIraqIrelandIsraelItalyJamaicaJapanJordanKazakhstanKenyaKoreaKuwaitLaosLatin AmericaLatviaLebanonLiberiaLithuaniaMalaysiaMexicoMicronesiaMiddle AfricaMoldovaMoroccoNepalNetherlandsNicaraguaNigeriaNorth AmericaNorth MacedoniaNorthern AfricaNorthern EuropeNorwayOceaniaPakistanPanamaPeruPhilippinesPolandPortugalRomaniaRussiaSaudi ArabiaScotlandSenegalSerbiaSierra LeoneSingaporeSomaliaSouth AfricaSouth AmericaSouth Central AsiaSouth Eastern AsiaSouthern EuropeSpainSri LankaSt. Vincent and the GrenadinesSudanSwedenSwitzerlandSyriaTaiwanThailandTrinidad and TobagoTurkeyUgandaUkraineUruguayUzbekistanVenezuelaVietnamWest IndiesWestern AfricaWestern AsiaWestern EuropeYemenZaireZimbabweAzores
Immigrants from Bolivia
Race
Ancestry
AfghanAfricanAlaska NativeAlaskan AthabascanAlbanianAleutAlsatianAmericanApacheArabArapahoArgentineanArmenianAssyrian/Chaldean/SyriacAustralianAustrianBahamianBangladeshiBarbadianBasqueBelgianBelizeanBermudanBhutaneseBlackfeetBolivianBrazilianBritishBritish West IndianBulgarianBurmeseCajunCambodianCanadianCape VerdeanCarpatho RusynCelticCentral AmericanCentral American IndianCherokeeCheyenneChickasawChileanChineseChippewaChoctawColombianColvilleComancheCosta RicanCreeCreekCroatianCrowCubanCypriotCzechCzechoslovakianDanishDelawareDominicanDutchDutch West IndianEastern EuropeanEcuadorianEgyptianEnglishEstonianEthiopianEuropeanFijianFilipinoFinnishFrenchFrench American IndianFrench CanadianGermanGerman RussianGhanaianGreekGuamanian/ChamorroGuatemalanGuyaneseHaitianHmongHonduranHopiHoumaHungarianIcelanderIndian (Asian)InupiatIranianIraqiIrishIroquoisIsraeliItalianJamaicanJapaneseJordanianKenyanKiowaKoreanLaotianLatvianLebaneseLiberianLithuanianLumbeeLuxembourgerMacedonianMalaysianMalteseMarshalleseMenomineeMexicanMexican American IndianMongolianMoroccanNative HawaiianNavajoNepaleseNew ZealanderNicaraguanNigerianNorthern EuropeanNorwegianOkinawanOsageOttawaPaiutePakistaniPalestinianPanamanianParaguayanPennsylvania GermanPeruvianPimaPolishPortuguesePotawatomiPuebloPuerto RicanPuget Sound SalishRomanianRussianSalvadoranSamoanScandinavianScotch-IrishScottishSeminoleSenegaleseSerbianShoshoneSierra LeoneanSiouxSlavicSlovakSloveneSomaliSouth AfricanSouth AmericanSouth American IndianSoviet UnionSpaniardSpanishSpanish AmericanSpanish American IndianSri LankanSubsaharan AfricanSudaneseSwedishSwissSyrianTaiwaneseThaiTlingit-HaidaTohono O'OdhamTonganTrinidadian and TobagonianTsimshianTurkishU.S. Virgin IslanderUgandanUkrainianUruguayanUteVenezuelanVietnameseWelshWest IndianYakamaYaquiYugoslavianYumanYup'ikZimbabwean
Immigration
NonimmigrantsImmigrantsAfghanistanAfricaAlbaniaArgentinaArmeniaAsiaAustraliaAustriaBahamasBangladeshBarbadosBelarusBelgiumBelizeBoliviaBosnia and HerzegovinaBrazilBulgariaBurma/MyanmarCabo VerdeCambodiaCameroonCanadaCaribbeanCentral AmericaChileChinaColombiaCongoCosta RicaCroatiaCubaCzechoslovakiaDenmarkDominicaDominican RepublicEastern AfricaEastern AsiaEastern EuropeEcuadorEgyptEl SalvadorEnglandEritreaEthiopiaEuropeFijiFranceGermanyGhanaGreeceGrenadaGuatemalaGuyanaHaitiHondurasHong KongHungaryIndiaIndonesiaIranIraqIrelandIsraelItalyJamaicaJapanJordanKazakhstanKenyaKoreaKuwaitLaosLatin AmericaLatviaLebanonLiberiaLithuaniaMalaysiaMexicoMicronesiaMiddle AfricaMoldovaMoroccoNepalNetherlandsNicaraguaNigeriaNorth AmericaNorth MacedoniaNorthern AfricaNorthern EuropeNorwayOceaniaPakistanPanamaPeruPhilippinesPolandPortugalRomaniaRussiaSaudi ArabiaScotlandSenegalSerbiaSierra LeoneSingaporeSomaliaSouth AfricaSouth AmericaSouth Central AsiaSouth Eastern AsiaSouthern EuropeSpainSri LankaSt. Vincent and the GrenadinesSudanSwedenSwitzerlandSyriaTaiwanThailandTrinidad and TobagoTurkeyUgandaUkraineUruguayUzbekistanVenezuelaVietnamWest IndiesWestern AfricaWestern AsiaWestern EuropeYemenZaireZimbabweAzores
Bachelor's Degree
Income
Poverty
Unemployment
Labor Participation
Family Structure
Vehicle Availability
Education Level
Disability

Bachelor's Degree Comparison

Indonesians

Immigrants from Bolivia

Tragic
Exceptional
33.5%
BACHELOR'S DEGREE
0.9/ 100
METRIC RATING
250th/ 347
METRIC RANK
44.2%
BACHELOR'S DEGREE
99.9/ 100
METRIC RATING
55th/ 347
METRIC RANK

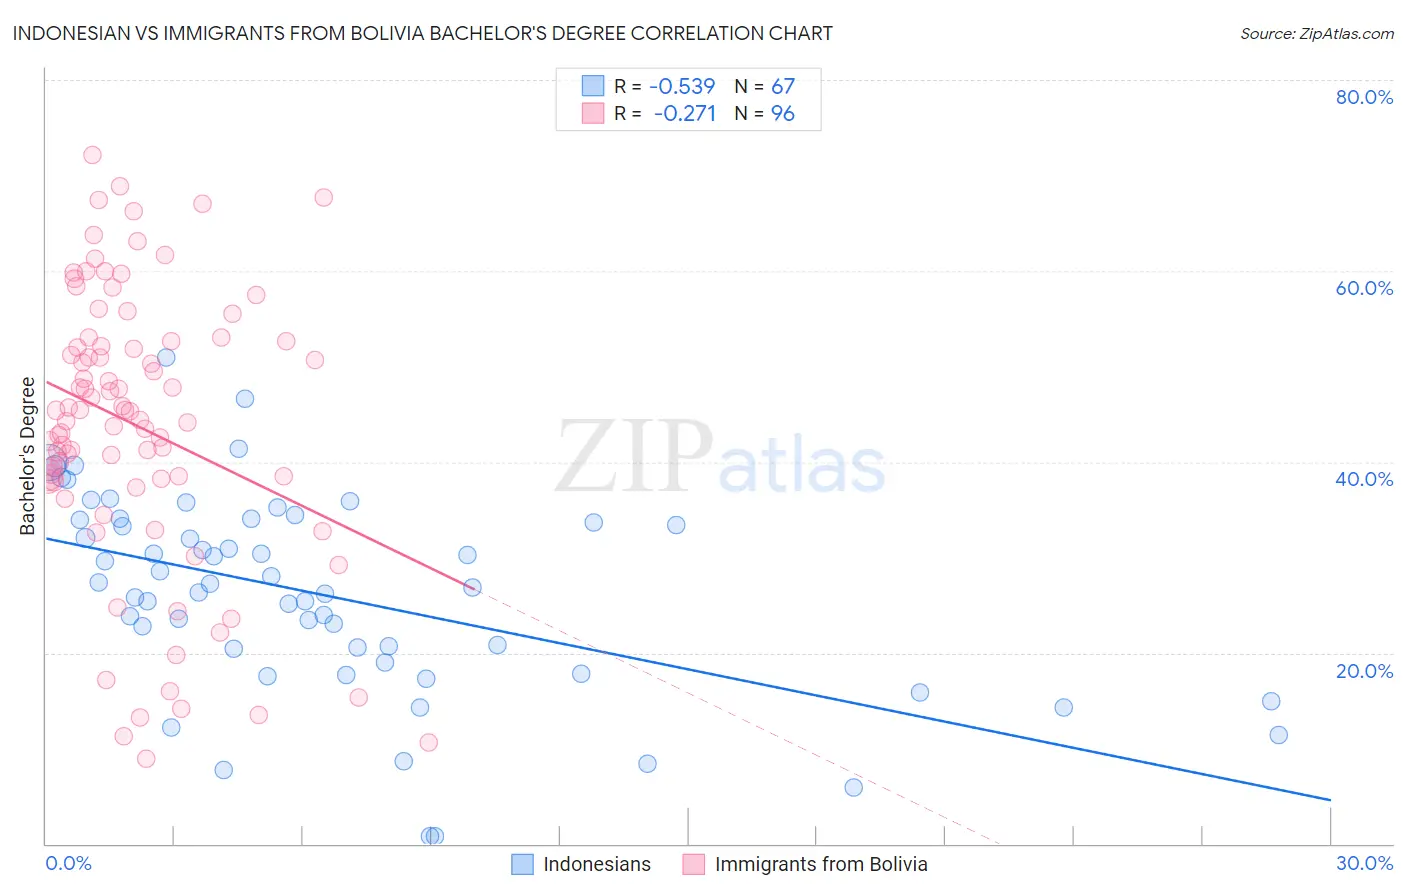
Indonesian vs Immigrants from Bolivia Bachelor's Degree Correlation Chart

The statistical analysis conducted on geographies consisting of 162,716,505 people shows a substantial negative correlation between the proportion of Indonesians and percentage of population with at least bachelor's degree education in the United States with a correlation coefficient (R) of -0.539 and weighted average of 33.5%. Similarly, the statistical analysis conducted on geographies consisting of 158,728,335 people shows a weak negative correlation between the proportion of Immigrants from Bolivia and percentage of population with at least bachelor's degree education in the United States with a correlation coefficient (R) of -0.271 and weighted average of 44.2%, a difference of 31.8%.
Indonesian vs Immigrants from Bolivia Bachelor's Degree

Bachelor's Degree Correlation Summary

MeasurementIndonesianImmigrants from Bolivia
Minimum0.73%8.9%
Maximum50.9%72.2%
Range50.2%63.3%
Mean26.1%43.8%
Median26.9%45.3%
Interquartile 25% (IQ1)19.0%38.1%
Interquartile 75% (IQ3)33.9%52.6%
Interquartile Range (IQR)14.9%14.6%
Standard Deviation (Sample)10.5%14.6%
Standard Deviation (Population)10.4%14.5%

Similar Demographics by Bachelor's Degree

Demographics Similar to Indonesians by Bachelor's Degree

In terms of bachelor's degree, the demographic groups most similar to Indonesians are Immigrants from Liberia (33.5%, a difference of 0.010%), Cree (33.6%, a difference of 0.13%), Immigrants from Congo (33.6%, a difference of 0.15%), Jamaican (33.6%, a difference of 0.24%), and Immigrants from Fiji (33.7%, a difference of 0.60%).
DemographicsRating | RankBachelor's Degree
Immigrants | Guyana
1.4
/100
|
#243
Tragic
33.9%
Delaware
1.2
/100
|
#244
Tragic
33.8%
Immigrants | Fiji
1.2
/100
|
#245
Tragic
33.7%
Jamaicans
1.0
/100
|
#246
Tragic
33.6%
Immigrants | Congo
1.0
/100
|
#247
Tragic
33.6%
Cree
1.0
/100
|
#248
Tragic
33.6%
Immigrants | Liberia
0.9
/100
|
#249
Tragic
33.5%
Indonesians
0.9
/100
|
#250
Tragic
33.5%
Japanese
0.7
/100
|
#251
Tragic
33.3%
Immigrants | Bahamas
0.7
/100
|
#252
Tragic
33.3%
U.S. Virgin Islanders
0.7
/100
|
#253
Tragic
33.2%
Native Hawaiians
0.7
/100
|
#254
Tragic
33.2%
Iroquois
0.7
/100
|
#255
Tragic
33.2%
Nicaraguans
0.6
/100
|
#256
Tragic
33.1%
Spanish Americans
0.6
/100
|
#257
Tragic
33.1%

Demographics Similar to Immigrants from Bolivia by Bachelor's Degree

In terms of bachelor's degree, the demographic groups most similar to Immigrants from Bolivia are Immigrants from Austria (44.2%, a difference of 0.0%), Immigrants from Serbia (44.1%, a difference of 0.18%), Immigrants from Asia (44.3%, a difference of 0.19%), Immigrants from Spain (44.3%, a difference of 0.25%), and Paraguayan (44.0%, a difference of 0.37%).
DemographicsRating | RankBachelor's Degree
Estonians
99.9
/100
|
#48
Exceptional
44.6%
Immigrants | Norway
99.9
/100
|
#49
Exceptional
44.5%
Immigrants | Greece
99.9
/100
|
#50
Exceptional
44.5%
Asians
99.9
/100
|
#51
Exceptional
44.4%
Immigrants | Spain
99.9
/100
|
#52
Exceptional
44.3%
Immigrants | Asia
99.9
/100
|
#53
Exceptional
44.3%
Immigrants | Austria
99.9
/100
|
#54
Exceptional
44.2%
Immigrants | Bolivia
99.9
/100
|
#55
Exceptional
44.2%
Immigrants | Serbia
99.9
/100
|
#56
Exceptional
44.1%
Paraguayans
99.9
/100
|
#57
Exceptional
44.0%
Immigrants | Czechoslovakia
99.9
/100
|
#58
Exceptional
44.0%
Australians
99.9
/100
|
#59
Exceptional
44.0%
New Zealanders
99.9
/100
|
#60
Exceptional
44.0%
South Africans
99.8
/100
|
#61
Exceptional
43.6%
Immigrants | Kazakhstan
99.8
/100
|
#62
Exceptional
43.4%