Indonesian vs Turkish Bachelor's Degree
COMPARE
Indonesian
Turkish
Bachelor's Degree
Bachelor's Degree Comparison
Indonesians
Turks
33.5%
BACHELOR'S DEGREE
0.9/ 100
METRIC RATING
250th/ 347
METRIC RANK
46.2%
BACHELOR'S DEGREE
100.0/ 100
METRIC RATING
28th/ 347
METRIC RANK
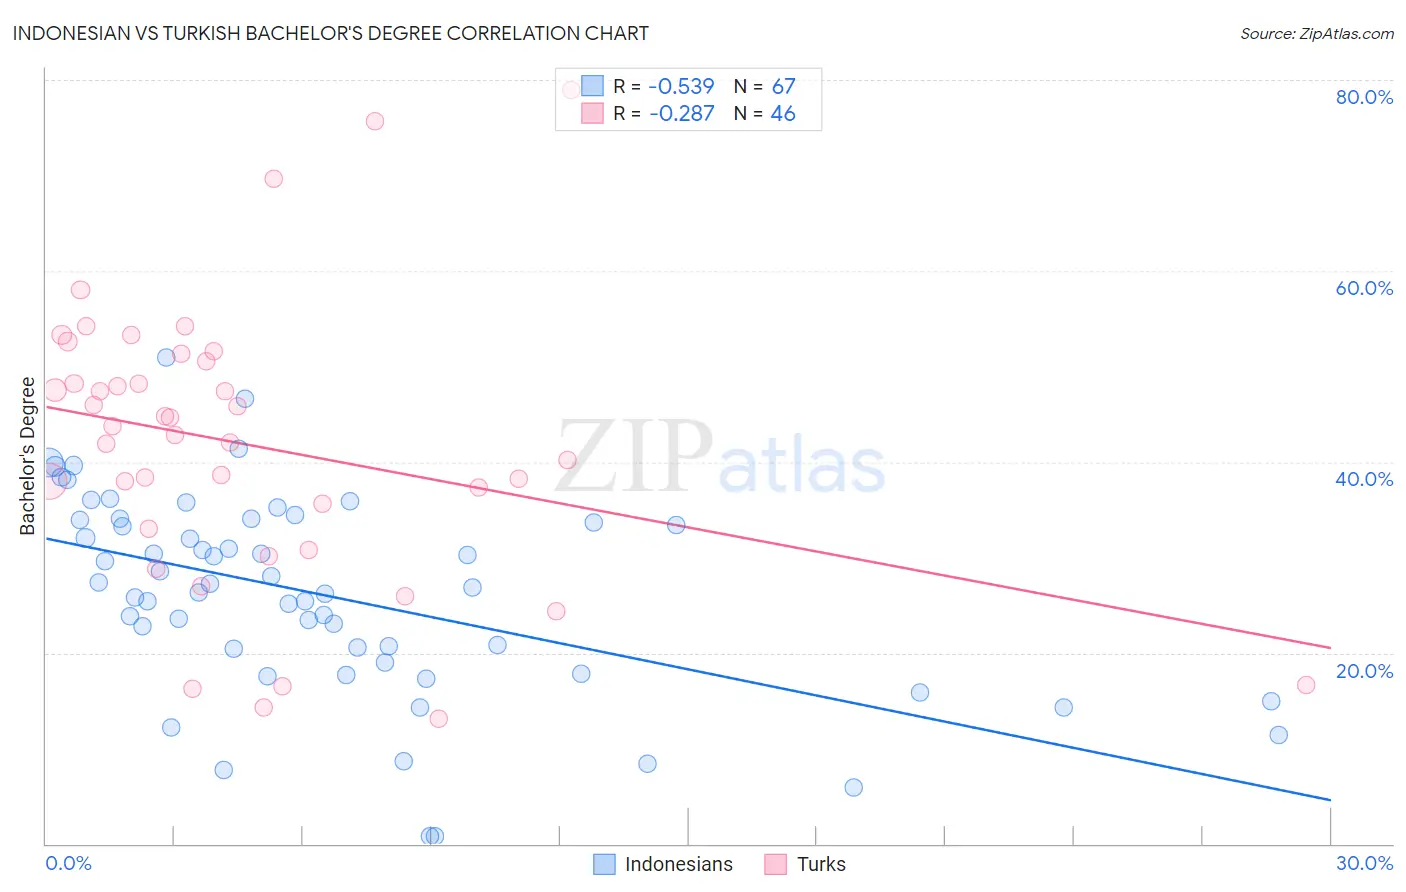
Indonesian vs Turkish Bachelor's Degree Correlation Chart
The statistical analysis conducted on geographies consisting of 162,716,505 people shows a substantial negative correlation between the proportion of Indonesians and percentage of population with at least bachelor's degree education in the United States with a correlation coefficient (R) of -0.539 and weighted average of 33.5%. Similarly, the statistical analysis conducted on geographies consisting of 271,847,696 people shows a weak negative correlation between the proportion of Turks and percentage of population with at least bachelor's degree education in the United States with a correlation coefficient (R) of -0.287 and weighted average of 46.2%, a difference of 37.7%.
Bachelor's Degree Correlation Summary
| Measurement | Indonesian | Turkish |
| Minimum | 0.73% | 13.1% |
| Maximum | 50.9% | 78.9% |
| Range | 50.2% | 65.8% |
| Mean | 26.1% | 41.8% |
| Median | 26.9% | 43.3% |
| Interquartile 25% (IQ1) | 19.0% | 33.0% |
| Interquartile 75% (IQ3) | 33.9% | 50.5% |
| Interquartile Range (IQR) | 14.9% | 17.5% |
| Standard Deviation (Sample) | 10.5% | 14.7% |
| Standard Deviation (Population) | 10.4% | 14.5% |
Similar Demographics by Bachelor's Degree
Demographics Similar to Indonesians by Bachelor's Degree
In terms of bachelor's degree, the demographic groups most similar to Indonesians are Immigrants from Liberia (33.5%, a difference of 0.010%), Cree (33.6%, a difference of 0.13%), Immigrants from Congo (33.6%, a difference of 0.15%), Jamaican (33.6%, a difference of 0.24%), and Immigrants from Fiji (33.7%, a difference of 0.60%).
| Demographics | Rating | Rank | Bachelor's Degree |
| Immigrants | Guyana | 1.4 /100 | #243 | Tragic 33.9% |
| Delaware | 1.2 /100 | #244 | Tragic 33.8% |
| Immigrants | Fiji | 1.2 /100 | #245 | Tragic 33.7% |
| Jamaicans | 1.0 /100 | #246 | Tragic 33.6% |
| Immigrants | Congo | 1.0 /100 | #247 | Tragic 33.6% |
| Cree | 1.0 /100 | #248 | Tragic 33.6% |
| Immigrants | Liberia | 0.9 /100 | #249 | Tragic 33.5% |
| Indonesians | 0.9 /100 | #250 | Tragic 33.5% |
| Japanese | 0.7 /100 | #251 | Tragic 33.3% |
| Immigrants | Bahamas | 0.7 /100 | #252 | Tragic 33.3% |
| U.S. Virgin Islanders | 0.7 /100 | #253 | Tragic 33.2% |
| Native Hawaiians | 0.7 /100 | #254 | Tragic 33.2% |
| Iroquois | 0.7 /100 | #255 | Tragic 33.2% |
| Nicaraguans | 0.6 /100 | #256 | Tragic 33.1% |
| Spanish Americans | 0.6 /100 | #257 | Tragic 33.1% |
Demographics Similar to Turks by Bachelor's Degree
In terms of bachelor's degree, the demographic groups most similar to Turks are Israeli (46.1%, a difference of 0.13%), Immigrants from Sri Lanka (46.1%, a difference of 0.18%), Latvian (46.1%, a difference of 0.22%), Immigrants from France (46.4%, a difference of 0.46%), and Immigrants from Turkey (46.0%, a difference of 0.52%).
| Demographics | Rating | Rank | Bachelor's Degree |
| Immigrants | Ireland | 100.0 /100 | #21 | Exceptional 47.1% |
| Immigrants | Belgium | 100.0 /100 | #22 | Exceptional 47.0% |
| Immigrants | Sweden | 100.0 /100 | #23 | Exceptional 47.0% |
| Immigrants | Korea | 100.0 /100 | #24 | Exceptional 47.0% |
| Burmese | 100.0 /100 | #25 | Exceptional 46.9% |
| Immigrants | Japan | 100.0 /100 | #26 | Exceptional 46.8% |
| Immigrants | France | 100.0 /100 | #27 | Exceptional 46.4% |
| Turks | 100.0 /100 | #28 | Exceptional 46.2% |
| Israelis | 100.0 /100 | #29 | Exceptional 46.1% |
| Immigrants | Sri Lanka | 100.0 /100 | #30 | Exceptional 46.1% |
| Latvians | 100.0 /100 | #31 | Exceptional 46.1% |
| Immigrants | Turkey | 100.0 /100 | #32 | Exceptional 46.0% |
| Immigrants | Northern Europe | 100.0 /100 | #33 | Exceptional 45.6% |
| Immigrants | Denmark | 100.0 /100 | #34 | Exceptional 45.4% |
| Immigrants | Russia | 100.0 /100 | #35 | Exceptional 45.4% |