Syrian vs Soviet Union Bachelor's Degree
COMPARE
Syrian
Soviet Union
Bachelor's Degree
Bachelor's Degree Comparison
Syrians
Soviet Union
41.1%
BACHELOR'S DEGREE
97.4/ 100
METRIC RATING
105th/ 347
METRIC RANK
47.9%
BACHELOR'S DEGREE
100.0/ 100
METRIC RATING
16th/ 347
METRIC RANK
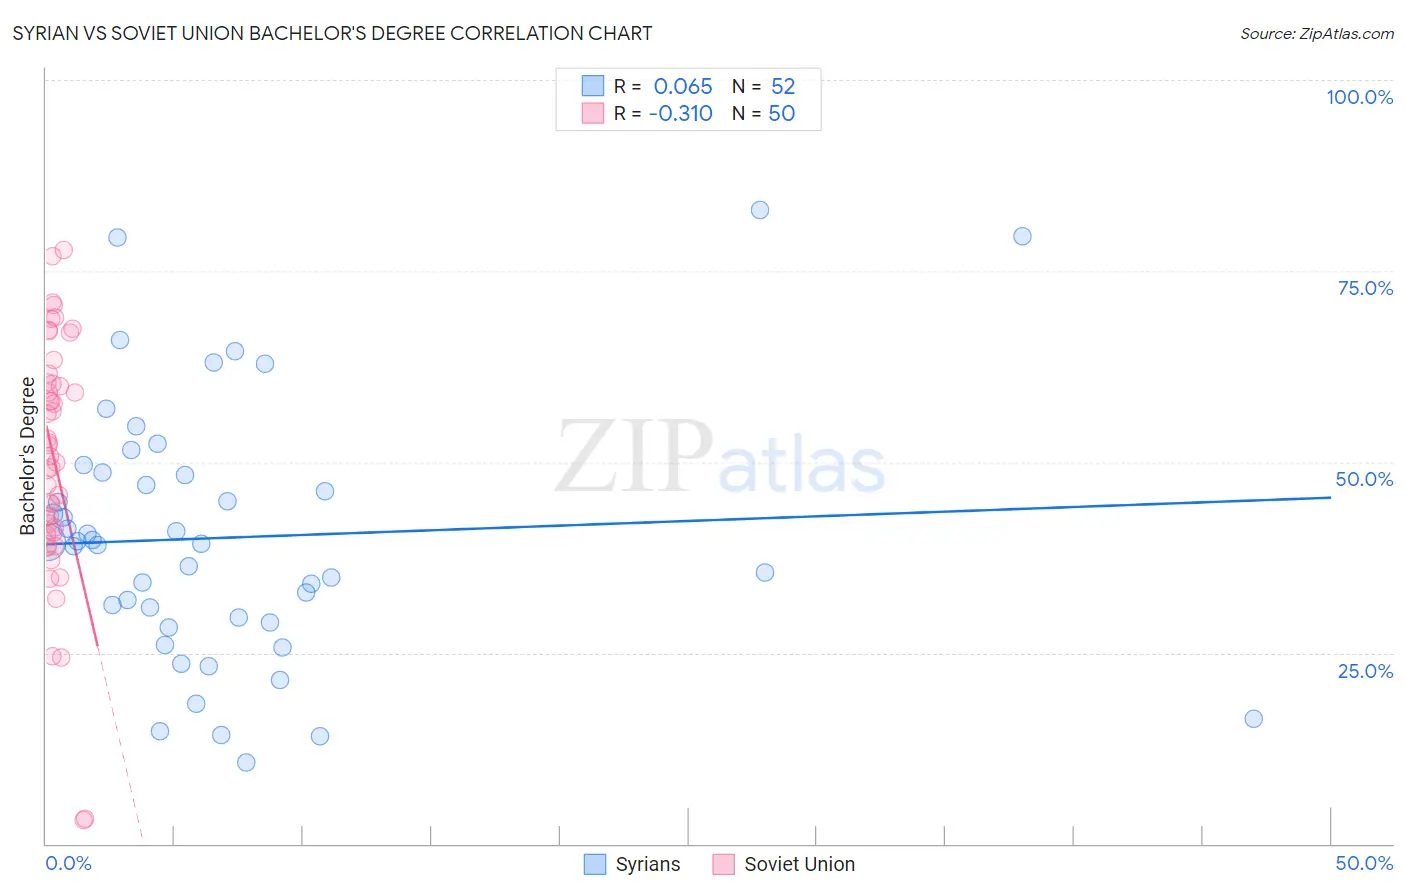
Syrian vs Soviet Union Bachelor's Degree Correlation Chart
The statistical analysis conducted on geographies consisting of 266,300,511 people shows a slight positive correlation between the proportion of Syrians and percentage of population with at least bachelor's degree education in the United States with a correlation coefficient (R) of 0.065 and weighted average of 41.1%. Similarly, the statistical analysis conducted on geographies consisting of 43,514,626 people shows a mild negative correlation between the proportion of Soviet Union and percentage of population with at least bachelor's degree education in the United States with a correlation coefficient (R) of -0.310 and weighted average of 47.9%, a difference of 16.5%.
Bachelor's Degree Correlation Summary
| Measurement | Syrian | Soviet Union |
| Minimum | 10.6% | 3.1% |
| Maximum | 83.0% | 77.7% |
| Range | 72.4% | 74.6% |
| Mean | 40.1% | 50.2% |
| Median | 39.4% | 51.5% |
| Interquartile 25% (IQ1) | 29.4% | 40.7% |
| Interquartile 75% (IQ3) | 48.4% | 60.5% |
| Interquartile Range (IQR) | 19.1% | 19.8% |
| Standard Deviation (Sample) | 16.8% | 16.2% |
| Standard Deviation (Population) | 16.6% | 16.0% |
Similar Demographics by Bachelor's Degree
Demographics Similar to Syrians by Bachelor's Degree
In terms of bachelor's degree, the demographic groups most similar to Syrians are Jordanian (41.2%, a difference of 0.030%), Chilean (41.2%, a difference of 0.090%), Alsatian (41.0%, a difference of 0.26%), Immigrants from Italy (41.3%, a difference of 0.43%), and Northern European (41.0%, a difference of 0.43%).
| Demographics | Rating | Rank | Bachelor's Degree |
| Immigrants | Ukraine | 98.3 /100 | #98 | Exceptional 41.5% |
| Immigrants | England | 98.1 /100 | #99 | Exceptional 41.4% |
| Macedonians | 98.1 /100 | #100 | Exceptional 41.4% |
| Immigrants | Morocco | 98.0 /100 | #101 | Exceptional 41.4% |
| Immigrants | Italy | 97.8 /100 | #102 | Exceptional 41.3% |
| Chileans | 97.5 /100 | #103 | Exceptional 41.2% |
| Jordanians | 97.4 /100 | #104 | Exceptional 41.2% |
| Syrians | 97.4 /100 | #105 | Exceptional 41.1% |
| Alsatians | 97.0 /100 | #106 | Exceptional 41.0% |
| Northern Europeans | 96.8 /100 | #107 | Exceptional 41.0% |
| Ukrainians | 96.6 /100 | #108 | Exceptional 40.9% |
| Arabs | 96.6 /100 | #109 | Exceptional 40.9% |
| Albanians | 96.5 /100 | #110 | Exceptional 40.9% |
| Immigrants | Chile | 96.4 /100 | #111 | Exceptional 40.8% |
| Ugandans | 96.3 /100 | #112 | Exceptional 40.8% |
Demographics Similar to Soviet Union by Bachelor's Degree
In terms of bachelor's degree, the demographic groups most similar to Soviet Union are Immigrants from Eastern Asia (48.1%, a difference of 0.46%), Immigrants from Hong Kong (48.2%, a difference of 0.60%), Eastern European (47.5%, a difference of 0.86%), Immigrants from South Central Asia (48.3%, a difference of 0.88%), and Indian (Asian) (47.4%, a difference of 1.0%).
| Demographics | Rating | Rank | Bachelor's Degree |
| Immigrants | Israel | 100.0 /100 | #9 | Exceptional 50.0% |
| Cypriots | 100.0 /100 | #10 | Exceptional 49.0% |
| Immigrants | Australia | 100.0 /100 | #11 | Exceptional 48.5% |
| Immigrants | China | 100.0 /100 | #12 | Exceptional 48.4% |
| Immigrants | South Central Asia | 100.0 /100 | #13 | Exceptional 48.3% |
| Immigrants | Hong Kong | 100.0 /100 | #14 | Exceptional 48.2% |
| Immigrants | Eastern Asia | 100.0 /100 | #15 | Exceptional 48.1% |
| Soviet Union | 100.0 /100 | #16 | Exceptional 47.9% |
| Eastern Europeans | 100.0 /100 | #17 | Exceptional 47.5% |
| Indians (Asian) | 100.0 /100 | #18 | Exceptional 47.4% |
| Cambodians | 100.0 /100 | #19 | Exceptional 47.2% |
| Immigrants | Switzerland | 100.0 /100 | #20 | Exceptional 47.1% |
| Immigrants | Ireland | 100.0 /100 | #21 | Exceptional 47.1% |
| Immigrants | Belgium | 100.0 /100 | #22 | Exceptional 47.0% |
| Immigrants | Sweden | 100.0 /100 | #23 | Exceptional 47.0% |