Indonesian vs Central American Doctorate Degree
COMPARE
Indonesian
Central American
Doctorate Degree
Doctorate Degree Comparison
Indonesians
Central Americans
1.6%
DOCTORATE DEGREE
2.8/ 100
METRIC RATING
236th/ 347
METRIC RANK
1.5%
DOCTORATE DEGREE
0.3/ 100
METRIC RATING
283rd/ 347
METRIC RANK
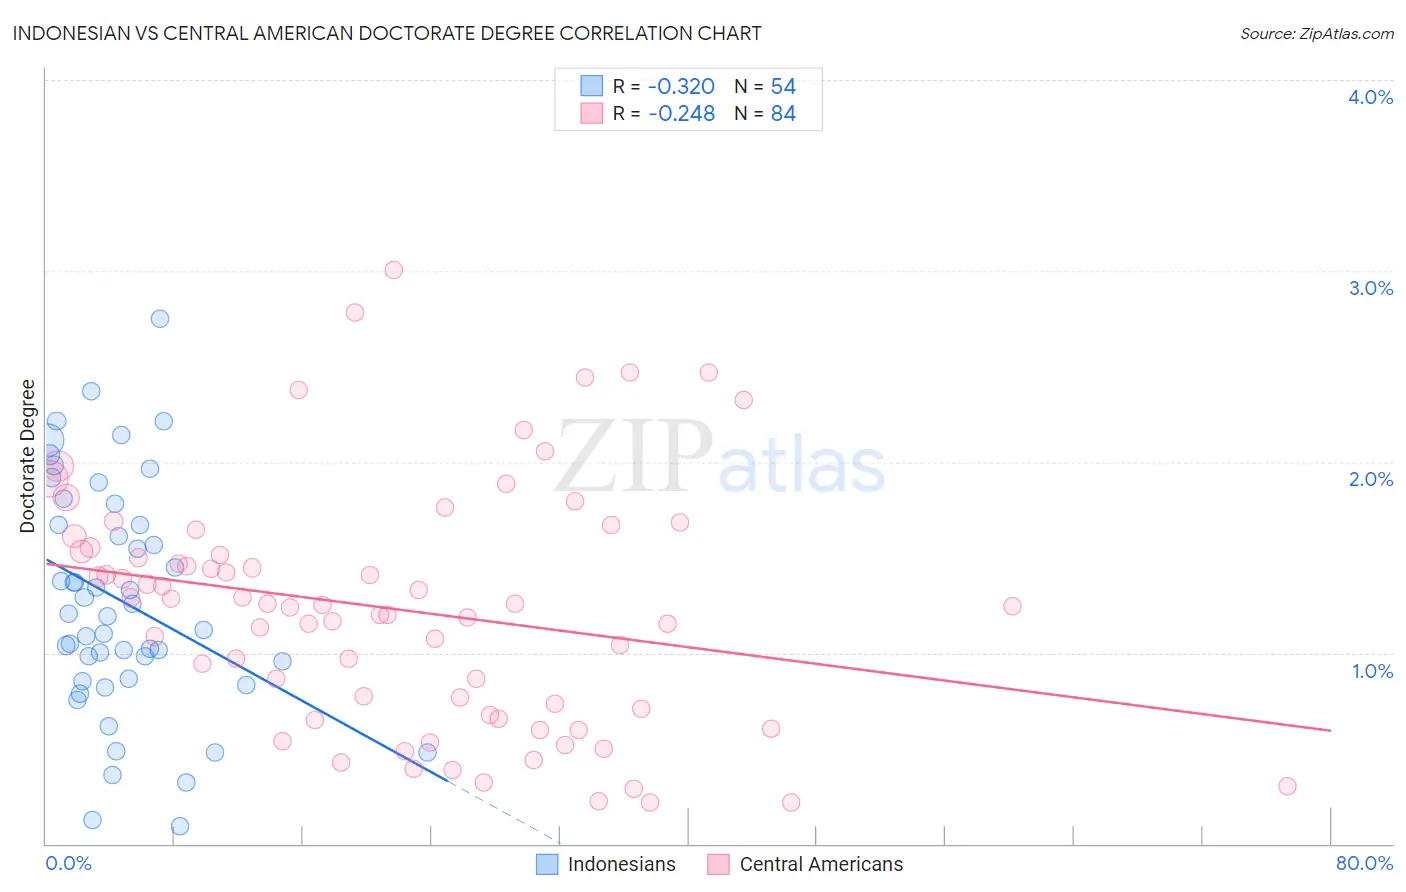
Indonesian vs Central American Doctorate Degree Correlation Chart
The statistical analysis conducted on geographies consisting of 162,227,737 people shows a mild negative correlation between the proportion of Indonesians and percentage of population with at least doctorate degree education in the United States with a correlation coefficient (R) of -0.320 and weighted average of 1.6%. Similarly, the statistical analysis conducted on geographies consisting of 493,729,899 people shows a weak negative correlation between the proportion of Central Americans and percentage of population with at least doctorate degree education in the United States with a correlation coefficient (R) of -0.248 and weighted average of 1.5%, a difference of 9.9%.
Doctorate Degree Correlation Summary
| Measurement | Indonesian | Central American |
| Minimum | 0.089% | 0.21% |
| Maximum | 2.7% | 3.0% |
| Range | 2.7% | 2.8% |
| Mean | 1.3% | 1.2% |
| Median | 1.2% | 1.2% |
| Interquartile 25% (IQ1) | 0.86% | 0.69% |
| Interquartile 75% (IQ3) | 1.7% | 1.5% |
| Interquartile Range (IQR) | 0.81% | 0.85% |
| Standard Deviation (Sample) | 0.60% | 0.63% |
| Standard Deviation (Population) | 0.59% | 0.63% |
Similar Demographics by Doctorate Degree
Demographics Similar to Indonesians by Doctorate Degree
In terms of doctorate degree, the demographic groups most similar to Indonesians are Iroquois (1.6%, a difference of 0.19%), Cree (1.6%, a difference of 0.29%), Immigrants from Congo (1.6%, a difference of 0.39%), Hopi (1.6%, a difference of 0.50%), and West Indian (1.6%, a difference of 0.50%).
| Demographics | Rating | Rank | Doctorate Degree |
| Colville | 4.7 /100 | #229 | Tragic 1.6% |
| Immigrants | Philippines | 4.3 /100 | #230 | Tragic 1.6% |
| Immigrants | North Macedonia | 3.9 /100 | #231 | Tragic 1.6% |
| Guamanians/Chamorros | 3.3 /100 | #232 | Tragic 1.6% |
| Barbadians | 3.3 /100 | #233 | Tragic 1.6% |
| Hopi | 3.2 /100 | #234 | Tragic 1.6% |
| Cree | 3.0 /100 | #235 | Tragic 1.6% |
| Indonesians | 2.8 /100 | #236 | Tragic 1.6% |
| Iroquois | 2.7 /100 | #237 | Tragic 1.6% |
| Immigrants | Congo | 2.6 /100 | #238 | Tragic 1.6% |
| West Indians | 2.5 /100 | #239 | Tragic 1.6% |
| Immigrants | Panama | 2.4 /100 | #240 | Tragic 1.6% |
| Cheyenne | 2.3 /100 | #241 | Tragic 1.6% |
| Ottawa | 2.2 /100 | #242 | Tragic 1.6% |
| Native Hawaiians | 2.1 /100 | #243 | Tragic 1.6% |
Demographics Similar to Central Americans by Doctorate Degree
In terms of doctorate degree, the demographic groups most similar to Central Americans are Jamaican (1.5%, a difference of 0.040%), British West Indian (1.5%, a difference of 0.050%), Malaysian (1.5%, a difference of 0.070%), Tohono O'odham (1.5%, a difference of 0.10%), and Ecuadorian (1.5%, a difference of 0.16%).
| Demographics | Rating | Rank | Doctorate Degree |
| Paiute | 0.4 /100 | #276 | Tragic 1.5% |
| Bahamians | 0.4 /100 | #277 | Tragic 1.5% |
| Hawaiians | 0.4 /100 | #278 | Tragic 1.5% |
| Marshallese | 0.4 /100 | #279 | Tragic 1.5% |
| Ecuadorians | 0.4 /100 | #280 | Tragic 1.5% |
| Tohono O'odham | 0.4 /100 | #281 | Tragic 1.5% |
| British West Indians | 0.3 /100 | #282 | Tragic 1.5% |
| Central Americans | 0.3 /100 | #283 | Tragic 1.5% |
| Jamaicans | 0.3 /100 | #284 | Tragic 1.5% |
| Malaysians | 0.3 /100 | #285 | Tragic 1.5% |
| Cherokee | 0.3 /100 | #286 | Tragic 1.5% |
| Cajuns | 0.3 /100 | #287 | Tragic 1.5% |
| Immigrants | El Salvador | 0.3 /100 | #288 | Tragic 1.4% |
| Cape Verdeans | 0.3 /100 | #289 | Tragic 1.4% |
| Choctaw | 0.3 /100 | #290 | Tragic 1.4% |