Indonesian vs European Doctorate Degree
COMPARE
Indonesian
European
Doctorate Degree
Doctorate Degree Comparison
Indonesians
Europeans
1.6%
DOCTORATE DEGREE
2.8/ 100
METRIC RATING
236th/ 347
METRIC RANK
2.1%
DOCTORATE DEGREE
97.5/ 100
METRIC RATING
107th/ 347
METRIC RANK
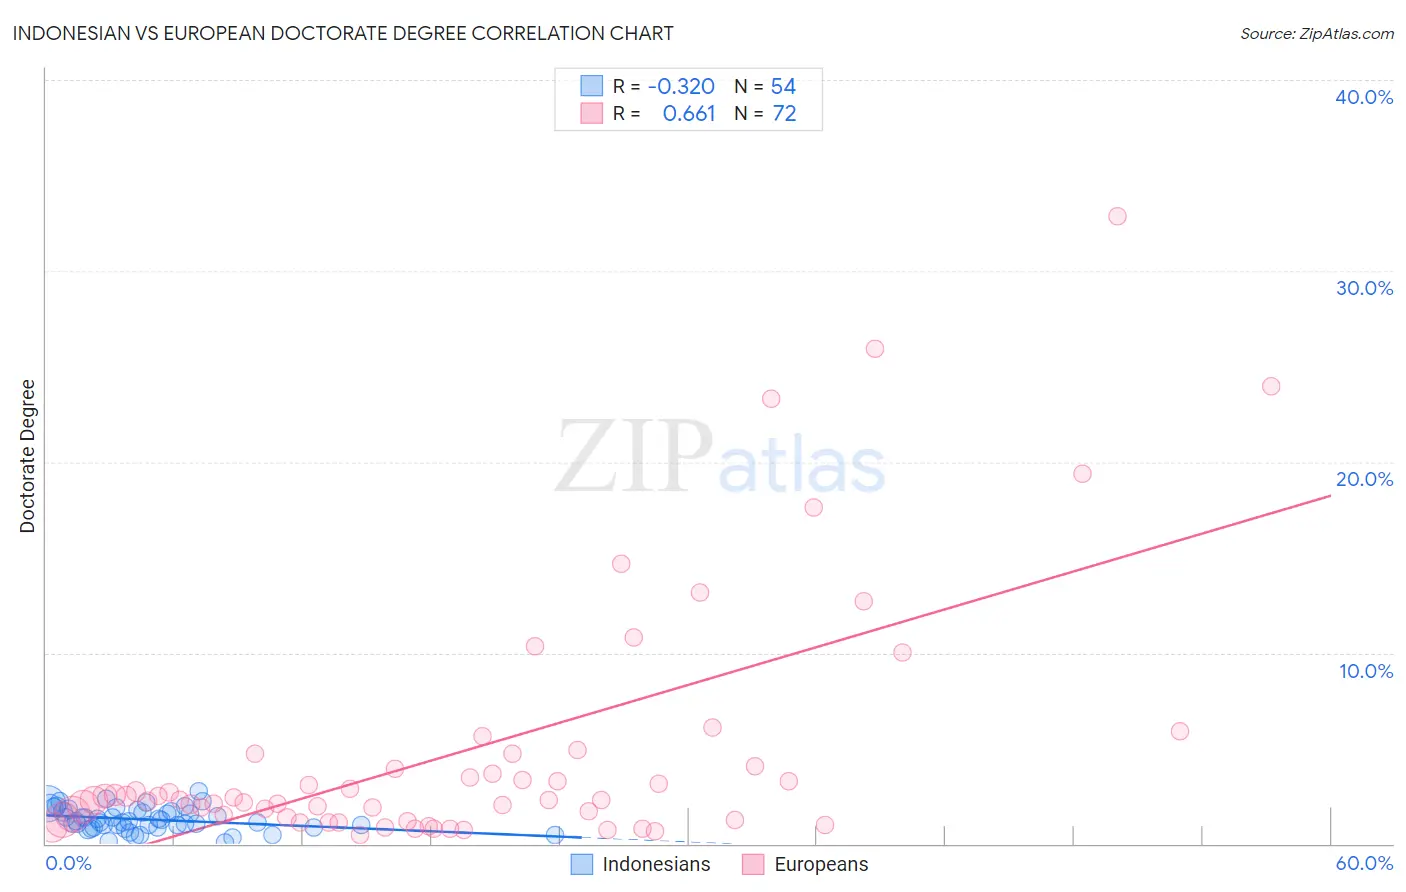
Indonesian vs European Doctorate Degree Correlation Chart
The statistical analysis conducted on geographies consisting of 162,227,737 people shows a mild negative correlation between the proportion of Indonesians and percentage of population with at least doctorate degree education in the United States with a correlation coefficient (R) of -0.320 and weighted average of 1.6%. Similarly, the statistical analysis conducted on geographies consisting of 540,466,833 people shows a significant positive correlation between the proportion of Europeans and percentage of population with at least doctorate degree education in the United States with a correlation coefficient (R) of 0.661 and weighted average of 2.1%, a difference of 30.2%.
Doctorate Degree Correlation Summary
| Measurement | Indonesian | European |
| Minimum | 0.089% | 0.48% |
| Maximum | 2.7% | 32.8% |
| Range | 2.7% | 32.4% |
| Mean | 1.3% | 4.9% |
| Median | 1.2% | 2.3% |
| Interquartile 25% (IQ1) | 0.86% | 1.3% |
| Interquartile 75% (IQ3) | 1.7% | 4.4% |
| Interquartile Range (IQR) | 0.81% | 3.1% |
| Standard Deviation (Sample) | 0.60% | 6.6% |
| Standard Deviation (Population) | 0.59% | 6.6% |
Similar Demographics by Doctorate Degree
Demographics Similar to Indonesians by Doctorate Degree
In terms of doctorate degree, the demographic groups most similar to Indonesians are Iroquois (1.6%, a difference of 0.19%), Cree (1.6%, a difference of 0.29%), Immigrants from Congo (1.6%, a difference of 0.39%), Hopi (1.6%, a difference of 0.50%), and West Indian (1.6%, a difference of 0.50%).
| Demographics | Rating | Rank | Doctorate Degree |
| Colville | 4.7 /100 | #229 | Tragic 1.6% |
| Immigrants | Philippines | 4.3 /100 | #230 | Tragic 1.6% |
| Immigrants | North Macedonia | 3.9 /100 | #231 | Tragic 1.6% |
| Guamanians/Chamorros | 3.3 /100 | #232 | Tragic 1.6% |
| Barbadians | 3.3 /100 | #233 | Tragic 1.6% |
| Hopi | 3.2 /100 | #234 | Tragic 1.6% |
| Cree | 3.0 /100 | #235 | Tragic 1.6% |
| Indonesians | 2.8 /100 | #236 | Tragic 1.6% |
| Iroquois | 2.7 /100 | #237 | Tragic 1.6% |
| Immigrants | Congo | 2.6 /100 | #238 | Tragic 1.6% |
| West Indians | 2.5 /100 | #239 | Tragic 1.6% |
| Immigrants | Panama | 2.4 /100 | #240 | Tragic 1.6% |
| Cheyenne | 2.3 /100 | #241 | Tragic 1.6% |
| Ottawa | 2.2 /100 | #242 | Tragic 1.6% |
| Native Hawaiians | 2.1 /100 | #243 | Tragic 1.6% |
Demographics Similar to Europeans by Doctorate Degree
In terms of doctorate degree, the demographic groups most similar to Europeans are Immigrants from Germany (2.1%, a difference of 0.22%), Ukrainian (2.1%, a difference of 0.28%), Brazilian (2.1%, a difference of 0.35%), Sudanese (2.1%, a difference of 0.39%), and Immigrants from Pakistan (2.1%, a difference of 0.41%).
| Demographics | Rating | Rank | Doctorate Degree |
| Immigrants | Eastern Europe | 98.2 /100 | #100 | Exceptional 2.1% |
| Immigrants | Eastern Africa | 98.2 /100 | #101 | Exceptional 2.1% |
| Immigrants | Chile | 98.1 /100 | #102 | Exceptional 2.1% |
| Romanians | 98.1 /100 | #103 | Exceptional 2.1% |
| Austrians | 98.0 /100 | #104 | Exceptional 2.1% |
| Arabs | 97.8 /100 | #105 | Exceptional 2.1% |
| Sudanese | 97.7 /100 | #106 | Exceptional 2.1% |
| Europeans | 97.5 /100 | #107 | Exceptional 2.1% |
| Immigrants | Germany | 97.3 /100 | #108 | Exceptional 2.1% |
| Ukrainians | 97.2 /100 | #109 | Exceptional 2.1% |
| Brazilians | 97.2 /100 | #110 | Exceptional 2.1% |
| Immigrants | Pakistan | 97.1 /100 | #111 | Exceptional 2.1% |
| Syrians | 97.1 /100 | #112 | Exceptional 2.1% |
| Immigrants | Italy | 96.9 /100 | #113 | Exceptional 2.1% |
| Immigrants | Croatia | 96.8 /100 | #114 | Exceptional 2.1% |