Indonesian vs Latvian Female Unemployment
COMPARE
Indonesian
Latvian
Female Unemployment
Female Unemployment Comparison
Indonesians
Latvians
5.0%
FEMALE UNEMPLOYMENT
95.1/ 100
METRIC RATING
100th/ 347
METRIC RANK
4.7%
FEMALE UNEMPLOYMENT
99.9/ 100
METRIC RATING
18th/ 347
METRIC RANK
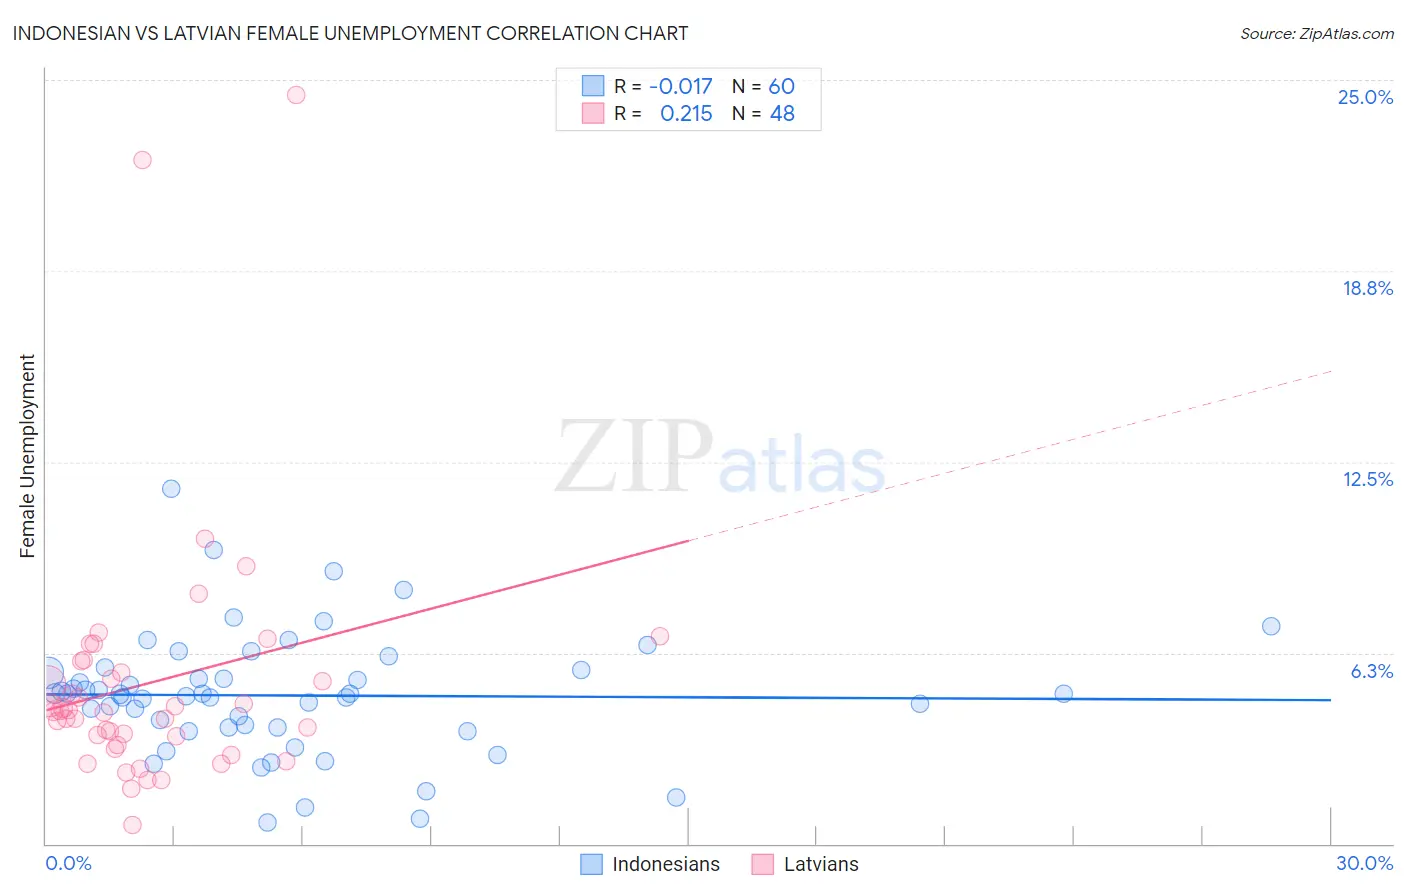
Indonesian vs Latvian Female Unemployment Correlation Chart
The statistical analysis conducted on geographies consisting of 162,464,387 people shows no correlation between the proportion of Indonesians and unemploymnet rate among females in the United States with a correlation coefficient (R) of -0.017 and weighted average of 5.0%. Similarly, the statistical analysis conducted on geographies consisting of 220,201,927 people shows a weak positive correlation between the proportion of Latvians and unemploymnet rate among females in the United States with a correlation coefficient (R) of 0.215 and weighted average of 4.7%, a difference of 7.3%.
Female Unemployment Correlation Summary
| Measurement | Indonesian | Latvian |
| Minimum | 0.70% | 0.60% |
| Maximum | 11.6% | 24.5% |
| Range | 10.9% | 23.9% |
| Mean | 4.9% | 5.3% |
| Median | 4.9% | 4.3% |
| Interquartile 25% (IQ1) | 3.8% | 3.4% |
| Interquartile 75% (IQ3) | 5.6% | 5.8% |
| Interquartile Range (IQR) | 1.9% | 2.4% |
| Standard Deviation (Sample) | 2.0% | 4.3% |
| Standard Deviation (Population) | 2.0% | 4.2% |
Similar Demographics by Female Unemployment
Demographics Similar to Indonesians by Female Unemployment
In terms of female unemployment, the demographic groups most similar to Indonesians are Immigrants from Zaire (5.0%, a difference of 0.020%), Immigrants from Somalia (5.0%, a difference of 0.030%), Immigrants from Kuwait (5.0%, a difference of 0.030%), Immigrants from Czechoslovakia (5.0%, a difference of 0.040%), and Immigrants from Kenya (5.0%, a difference of 0.10%).
| Demographics | Rating | Rank | Female Unemployment |
| Immigrants | Austria | 95.7 /100 | #93 | Exceptional 5.0% |
| Immigrants | Malaysia | 95.7 /100 | #94 | Exceptional 5.0% |
| Burmese | 95.6 /100 | #95 | Exceptional 5.0% |
| Immigrants | South Central Asia | 95.5 /100 | #96 | Exceptional 5.0% |
| Immigrants | Somalia | 95.2 /100 | #97 | Exceptional 5.0% |
| Immigrants | Kuwait | 95.2 /100 | #98 | Exceptional 5.0% |
| Immigrants | Zaire | 95.2 /100 | #99 | Exceptional 5.0% |
| Indonesians | 95.1 /100 | #100 | Exceptional 5.0% |
| Immigrants | Czechoslovakia | 95.0 /100 | #101 | Exceptional 5.0% |
| Immigrants | Kenya | 94.8 /100 | #102 | Exceptional 5.0% |
| Somalis | 94.6 /100 | #103 | Exceptional 5.0% |
| Kenyans | 93.7 /100 | #104 | Exceptional 5.0% |
| Immigrants | England | 93.6 /100 | #105 | Exceptional 5.0% |
| Paraguayans | 93.2 /100 | #106 | Exceptional 5.1% |
| Immigrants | Switzerland | 93.1 /100 | #107 | Exceptional 5.1% |
Demographics Similar to Latvians by Female Unemployment
In terms of female unemployment, the demographic groups most similar to Latvians are Polish (4.7%, a difference of 0.010%), Bulgarian (4.7%, a difference of 0.090%), Fijian (4.7%, a difference of 0.10%), European (4.7%, a difference of 0.12%), and Croatian (4.7%, a difference of 0.14%).
| Demographics | Rating | Rank | Female Unemployment |
| Scandinavians | 100.0 /100 | #11 | Exceptional 4.6% |
| Dutch | 100.0 /100 | #12 | Exceptional 4.6% |
| Belgians | 100.0 /100 | #13 | Exceptional 4.6% |
| Finns | 100.0 /100 | #14 | Exceptional 4.6% |
| English | 100.0 /100 | #15 | Exceptional 4.6% |
| Carpatho Rusyns | 99.9 /100 | #16 | Exceptional 4.7% |
| Croatians | 99.9 /100 | #17 | Exceptional 4.7% |
| Latvians | 99.9 /100 | #18 | Exceptional 4.7% |
| Poles | 99.9 /100 | #19 | Exceptional 4.7% |
| Bulgarians | 99.9 /100 | #20 | Exceptional 4.7% |
| Fijians | 99.9 /100 | #21 | Exceptional 4.7% |
| Europeans | 99.9 /100 | #22 | Exceptional 4.7% |
| Scottish | 99.9 /100 | #23 | Exceptional 4.7% |
| Welsh | 99.9 /100 | #24 | Exceptional 4.7% |
| Immigrants | India | 99.9 /100 | #25 | Exceptional 4.7% |