Indonesian vs Immigrants from Honduras Doctorate Degree
COMPARE
Indonesian
Immigrants from Honduras
Doctorate Degree
Doctorate Degree Comparison
Indonesians
Immigrants from Honduras
1.6%
DOCTORATE DEGREE
2.8/ 100
METRIC RATING
236th/ 347
METRIC RANK
1.4%
DOCTORATE DEGREE
0.1/ 100
METRIC RATING
311th/ 347
METRIC RANK
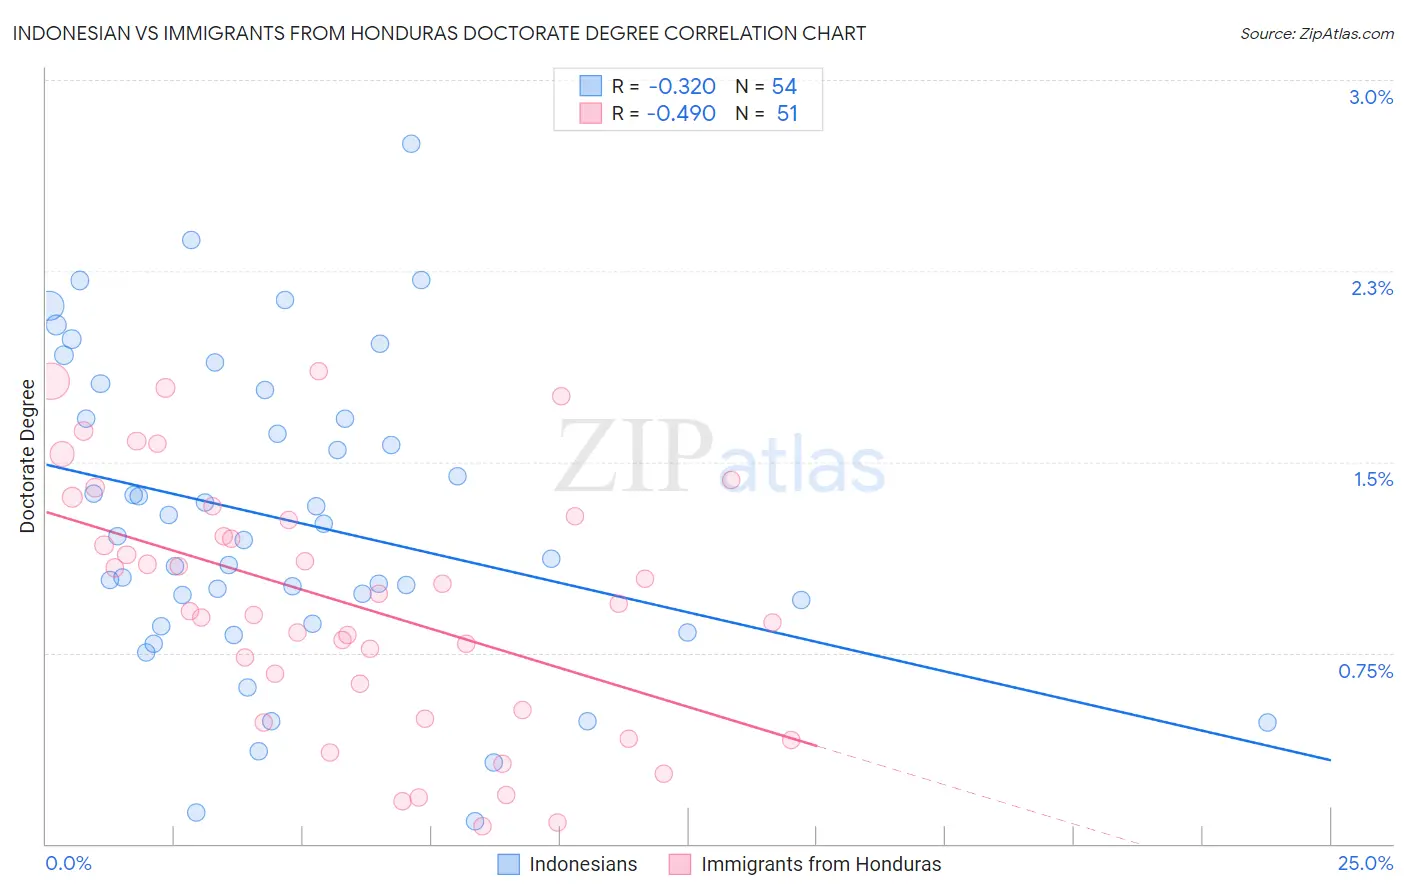
Indonesian vs Immigrants from Honduras Doctorate Degree Correlation Chart
The statistical analysis conducted on geographies consisting of 162,227,737 people shows a mild negative correlation between the proportion of Indonesians and percentage of population with at least doctorate degree education in the United States with a correlation coefficient (R) of -0.320 and weighted average of 1.6%. Similarly, the statistical analysis conducted on geographies consisting of 318,827,529 people shows a moderate negative correlation between the proportion of Immigrants from Honduras and percentage of population with at least doctorate degree education in the United States with a correlation coefficient (R) of -0.490 and weighted average of 1.4%, a difference of 17.3%.
Doctorate Degree Correlation Summary
| Measurement | Indonesian | Immigrants from Honduras |
| Minimum | 0.089% | 0.068% |
| Maximum | 2.7% | 1.9% |
| Range | 2.7% | 1.8% |
| Mean | 1.3% | 0.95% |
| Median | 1.2% | 0.94% |
| Interquartile 25% (IQ1) | 0.86% | 0.52% |
| Interquartile 75% (IQ3) | 1.7% | 1.3% |
| Interquartile Range (IQR) | 0.81% | 0.76% |
| Standard Deviation (Sample) | 0.60% | 0.49% |
| Standard Deviation (Population) | 0.59% | 0.48% |
Similar Demographics by Doctorate Degree
Demographics Similar to Indonesians by Doctorate Degree
In terms of doctorate degree, the demographic groups most similar to Indonesians are Iroquois (1.6%, a difference of 0.19%), Cree (1.6%, a difference of 0.29%), Immigrants from Congo (1.6%, a difference of 0.39%), Hopi (1.6%, a difference of 0.50%), and West Indian (1.6%, a difference of 0.50%).
| Demographics | Rating | Rank | Doctorate Degree |
| Colville | 4.7 /100 | #229 | Tragic 1.6% |
| Immigrants | Philippines | 4.3 /100 | #230 | Tragic 1.6% |
| Immigrants | North Macedonia | 3.9 /100 | #231 | Tragic 1.6% |
| Guamanians/Chamorros | 3.3 /100 | #232 | Tragic 1.6% |
| Barbadians | 3.3 /100 | #233 | Tragic 1.6% |
| Hopi | 3.2 /100 | #234 | Tragic 1.6% |
| Cree | 3.0 /100 | #235 | Tragic 1.6% |
| Indonesians | 2.8 /100 | #236 | Tragic 1.6% |
| Iroquois | 2.7 /100 | #237 | Tragic 1.6% |
| Immigrants | Congo | 2.6 /100 | #238 | Tragic 1.6% |
| West Indians | 2.5 /100 | #239 | Tragic 1.6% |
| Immigrants | Panama | 2.4 /100 | #240 | Tragic 1.6% |
| Cheyenne | 2.3 /100 | #241 | Tragic 1.6% |
| Ottawa | 2.2 /100 | #242 | Tragic 1.6% |
| Native Hawaiians | 2.1 /100 | #243 | Tragic 1.6% |
Demographics Similar to Immigrants from Honduras by Doctorate Degree
In terms of doctorate degree, the demographic groups most similar to Immigrants from Honduras are Immigrants from Jamaica (1.4%, a difference of 0.18%), Immigrants from Nicaragua (1.4%, a difference of 0.38%), Immigrants from Grenada (1.4%, a difference of 0.47%), Menominee (1.4%, a difference of 0.69%), and Dominican (1.4%, a difference of 0.77%).
| Demographics | Rating | Rank | Doctorate Degree |
| Mexican American Indians | 0.1 /100 | #304 | Tragic 1.4% |
| Pennsylvania Germans | 0.1 /100 | #305 | Tragic 1.4% |
| Guyanese | 0.1 /100 | #306 | Tragic 1.4% |
| Cubans | 0.1 /100 | #307 | Tragic 1.4% |
| Immigrants | Laos | 0.1 /100 | #308 | Tragic 1.4% |
| Immigrants | Grenada | 0.1 /100 | #309 | Tragic 1.4% |
| Immigrants | Jamaica | 0.1 /100 | #310 | Tragic 1.4% |
| Immigrants | Honduras | 0.1 /100 | #311 | Tragic 1.4% |
| Immigrants | Nicaragua | 0.1 /100 | #312 | Tragic 1.4% |
| Menominee | 0.1 /100 | #313 | Tragic 1.4% |
| Dominicans | 0.1 /100 | #314 | Tragic 1.4% |
| Immigrants | Azores | 0.1 /100 | #315 | Tragic 1.4% |
| Navajo | 0.1 /100 | #316 | Tragic 1.4% |
| Immigrants | Micronesia | 0.1 /100 | #317 | Tragic 1.3% |
| Creek | 0.1 /100 | #318 | Tragic 1.3% |