Inupiat vs Immigrants from Honduras Doctorate Degree
COMPARE
Inupiat
Immigrants from Honduras
Doctorate Degree
Doctorate Degree Comparison
Inupiat
Immigrants from Honduras
1.3%
DOCTORATE DEGREE
0.0/ 100
METRIC RATING
328th/ 347
METRIC RANK
1.4%
DOCTORATE DEGREE
0.1/ 100
METRIC RATING
311th/ 347
METRIC RANK
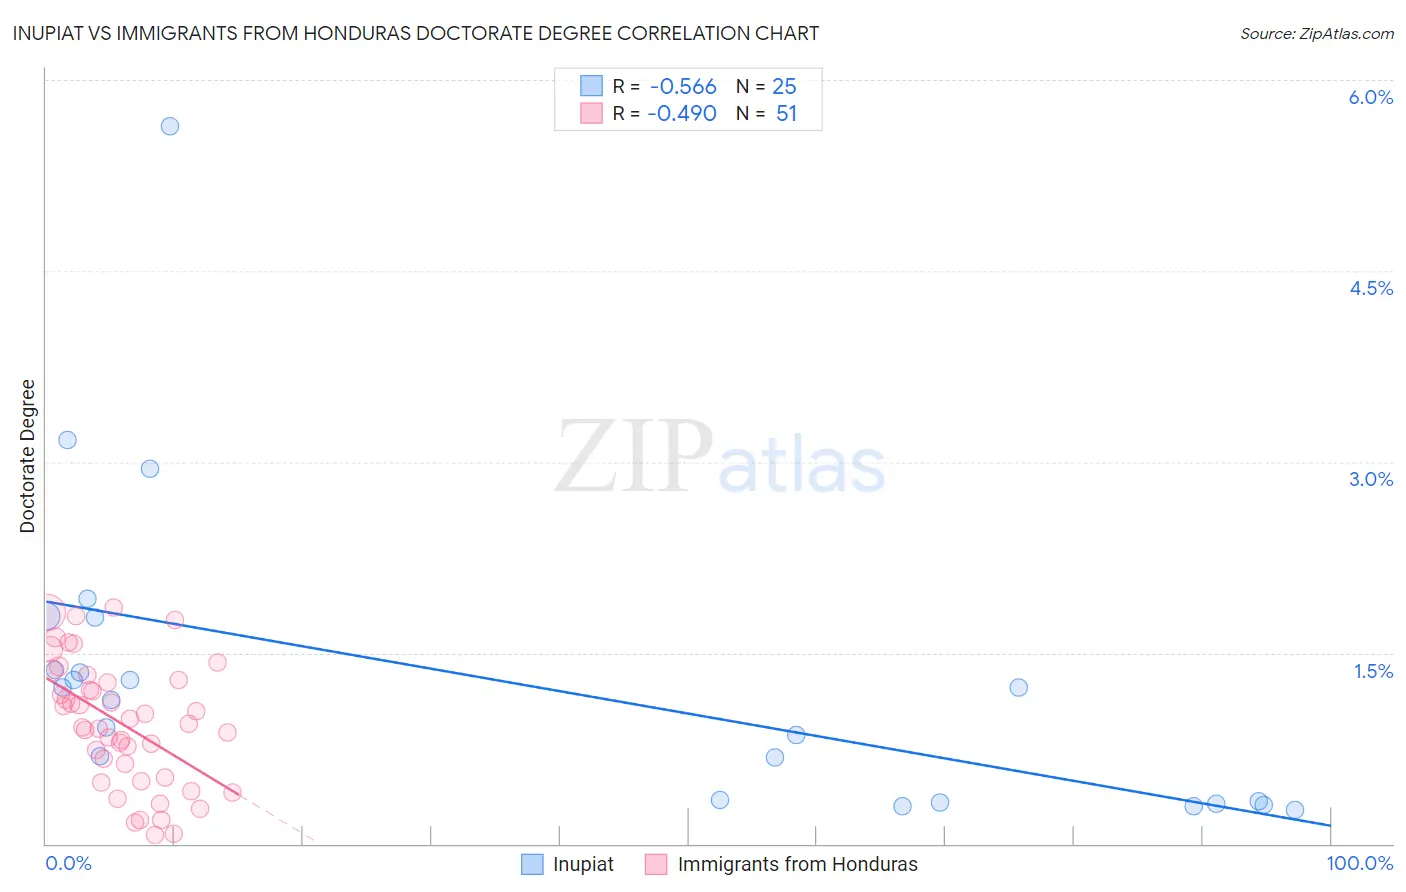
Inupiat vs Immigrants from Honduras Doctorate Degree Correlation Chart
The statistical analysis conducted on geographies consisting of 95,805,354 people shows a substantial negative correlation between the proportion of Inupiat and percentage of population with at least doctorate degree education in the United States with a correlation coefficient (R) of -0.566 and weighted average of 1.3%. Similarly, the statistical analysis conducted on geographies consisting of 318,827,529 people shows a moderate negative correlation between the proportion of Immigrants from Honduras and percentage of population with at least doctorate degree education in the United States with a correlation coefficient (R) of -0.490 and weighted average of 1.4%, a difference of 4.3%.
Doctorate Degree Correlation Summary
| Measurement | Inupiat | Immigrants from Honduras |
| Minimum | 0.27% | 0.068% |
| Maximum | 5.6% | 1.9% |
| Range | 5.4% | 1.8% |
| Mean | 1.3% | 0.95% |
| Median | 1.1% | 0.94% |
| Interquartile 25% (IQ1) | 0.33% | 0.52% |
| Interquartile 75% (IQ3) | 1.6% | 1.3% |
| Interquartile Range (IQR) | 1.2% | 0.76% |
| Standard Deviation (Sample) | 1.2% | 0.49% |
| Standard Deviation (Population) | 1.2% | 0.48% |
Demographics Similar to Inupiat and Immigrants from Honduras by Doctorate Degree
In terms of doctorate degree, the demographic groups most similar to Inupiat are Haitian (1.3%, a difference of 0.050%), Hispanic or Latino (1.3%, a difference of 0.58%), Immigrants from Cabo Verde (1.3%, a difference of 0.87%), Pima (1.3%, a difference of 0.89%), and Native/Alaskan (1.3%, a difference of 1.3%). Similarly, the demographic groups most similar to Immigrants from Honduras are Immigrants from Jamaica (1.4%, a difference of 0.18%), Immigrants from Nicaragua (1.4%, a difference of 0.38%), Immigrants from Grenada (1.4%, a difference of 0.47%), Menominee (1.4%, a difference of 0.69%), and Dominican (1.4%, a difference of 0.77%).
| Demographics | Rating | Rank | Doctorate Degree |
| Immigrants | Grenada | 0.1 /100 | #309 | Tragic 1.4% |
| Immigrants | Jamaica | 0.1 /100 | #310 | Tragic 1.4% |
| Immigrants | Honduras | 0.1 /100 | #311 | Tragic 1.4% |
| Immigrants | Nicaragua | 0.1 /100 | #312 | Tragic 1.4% |
| Menominee | 0.1 /100 | #313 | Tragic 1.4% |
| Dominicans | 0.1 /100 | #314 | Tragic 1.4% |
| Immigrants | Azores | 0.1 /100 | #315 | Tragic 1.4% |
| Navajo | 0.1 /100 | #316 | Tragic 1.4% |
| Immigrants | Micronesia | 0.1 /100 | #317 | Tragic 1.3% |
| Creek | 0.1 /100 | #318 | Tragic 1.3% |
| Immigrants | Guyana | 0.1 /100 | #319 | Tragic 1.3% |
| Immigrants | St. Vincent and the Grenadines | 0.1 /100 | #320 | Tragic 1.3% |
| Dutch West Indians | 0.1 /100 | #321 | Tragic 1.3% |
| Seminole | 0.1 /100 | #322 | Tragic 1.3% |
| Immigrants | Belize | 0.1 /100 | #323 | Tragic 1.3% |
| Natives/Alaskans | 0.0 /100 | #324 | Tragic 1.3% |
| Pima | 0.0 /100 | #325 | Tragic 1.3% |
| Immigrants | Cabo Verde | 0.0 /100 | #326 | Tragic 1.3% |
| Hispanics or Latinos | 0.0 /100 | #327 | Tragic 1.3% |
| Inupiat | 0.0 /100 | #328 | Tragic 1.3% |
| Haitians | 0.0 /100 | #329 | Tragic 1.3% |