Ugandan vs Immigrants from Honduras Doctorate Degree
COMPARE
Ugandan
Immigrants from Honduras
Doctorate Degree
Doctorate Degree Comparison
Ugandans
Immigrants from Honduras
2.2%
DOCTORATE DEGREE
99.7/ 100
METRIC RATING
80th/ 347
METRIC RANK
1.4%
DOCTORATE DEGREE
0.1/ 100
METRIC RATING
311th/ 347
METRIC RANK
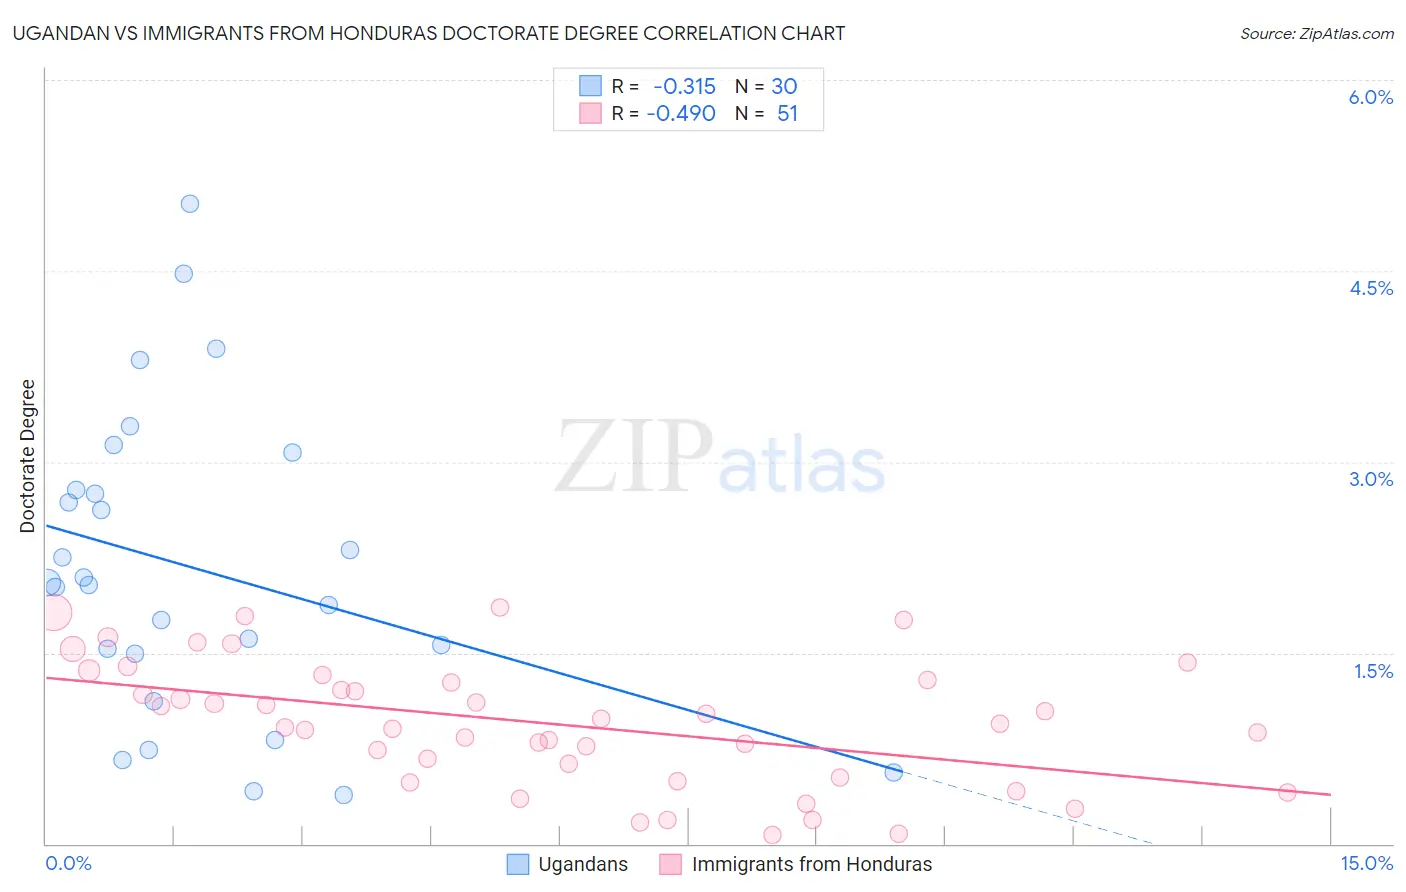
Ugandan vs Immigrants from Honduras Doctorate Degree Correlation Chart
The statistical analysis conducted on geographies consisting of 93,908,967 people shows a mild negative correlation between the proportion of Ugandans and percentage of population with at least doctorate degree education in the United States with a correlation coefficient (R) of -0.315 and weighted average of 2.2%. Similarly, the statistical analysis conducted on geographies consisting of 318,827,529 people shows a moderate negative correlation between the proportion of Immigrants from Honduras and percentage of population with at least doctorate degree education in the United States with a correlation coefficient (R) of -0.490 and weighted average of 1.4%, a difference of 63.2%.
Doctorate Degree Correlation Summary
| Measurement | Ugandan | Immigrants from Honduras |
| Minimum | 0.38% | 0.068% |
| Maximum | 5.0% | 1.9% |
| Range | 4.6% | 1.8% |
| Mean | 2.2% | 0.95% |
| Median | 2.0% | 0.94% |
| Interquartile 25% (IQ1) | 1.5% | 0.52% |
| Interquartile 75% (IQ3) | 2.8% | 1.3% |
| Interquartile Range (IQR) | 1.3% | 0.76% |
| Standard Deviation (Sample) | 1.2% | 0.49% |
| Standard Deviation (Population) | 1.2% | 0.48% |
Similar Demographics by Doctorate Degree
Demographics Similar to Ugandans by Doctorate Degree
In terms of doctorate degree, the demographic groups most similar to Ugandans are Immigrants from Argentina (2.2%, a difference of 0.050%), Northern European (2.2%, a difference of 0.28%), Immigrants from Belarus (2.2%, a difference of 0.35%), Immigrants from Uganda (2.2%, a difference of 0.59%), and Immigrants from Lithuania (2.2%, a difference of 0.77%).
| Demographics | Rating | Rank | Doctorate Degree |
| Immigrants | Bulgaria | 99.8 /100 | #73 | Exceptional 2.3% |
| Immigrants | North America | 99.8 /100 | #74 | Exceptional 2.2% |
| Immigrants | Western Asia | 99.8 /100 | #75 | Exceptional 2.2% |
| Immigrants | Hungary | 99.8 /100 | #76 | Exceptional 2.2% |
| Immigrants | Lebanon | 99.8 /100 | #77 | Exceptional 2.2% |
| Immigrants | Belarus | 99.7 /100 | #78 | Exceptional 2.2% |
| Northern Europeans | 99.7 /100 | #79 | Exceptional 2.2% |
| Ugandans | 99.7 /100 | #80 | Exceptional 2.2% |
| Immigrants | Argentina | 99.7 /100 | #81 | Exceptional 2.2% |
| Immigrants | Uganda | 99.6 /100 | #82 | Exceptional 2.2% |
| Immigrants | Lithuania | 99.6 /100 | #83 | Exceptional 2.2% |
| Immigrants | England | 99.6 /100 | #84 | Exceptional 2.2% |
| Immigrants | Brazil | 99.6 /100 | #85 | Exceptional 2.2% |
| Egyptians | 99.4 /100 | #86 | Exceptional 2.2% |
| Immigrants | Zimbabwe | 99.4 /100 | #87 | Exceptional 2.2% |
Demographics Similar to Immigrants from Honduras by Doctorate Degree
In terms of doctorate degree, the demographic groups most similar to Immigrants from Honduras are Immigrants from Jamaica (1.4%, a difference of 0.18%), Immigrants from Nicaragua (1.4%, a difference of 0.38%), Immigrants from Grenada (1.4%, a difference of 0.47%), Menominee (1.4%, a difference of 0.69%), and Dominican (1.4%, a difference of 0.77%).
| Demographics | Rating | Rank | Doctorate Degree |
| Mexican American Indians | 0.1 /100 | #304 | Tragic 1.4% |
| Pennsylvania Germans | 0.1 /100 | #305 | Tragic 1.4% |
| Guyanese | 0.1 /100 | #306 | Tragic 1.4% |
| Cubans | 0.1 /100 | #307 | Tragic 1.4% |
| Immigrants | Laos | 0.1 /100 | #308 | Tragic 1.4% |
| Immigrants | Grenada | 0.1 /100 | #309 | Tragic 1.4% |
| Immigrants | Jamaica | 0.1 /100 | #310 | Tragic 1.4% |
| Immigrants | Honduras | 0.1 /100 | #311 | Tragic 1.4% |
| Immigrants | Nicaragua | 0.1 /100 | #312 | Tragic 1.4% |
| Menominee | 0.1 /100 | #313 | Tragic 1.4% |
| Dominicans | 0.1 /100 | #314 | Tragic 1.4% |
| Immigrants | Azores | 0.1 /100 | #315 | Tragic 1.4% |
| Navajo | 0.1 /100 | #316 | Tragic 1.4% |
| Immigrants | Micronesia | 0.1 /100 | #317 | Tragic 1.3% |
| Creek | 0.1 /100 | #318 | Tragic 1.3% |