Indonesian vs Immigrants from Spain No Schooling Completed
COMPARE
Indonesian
Immigrants from Spain
No Schooling Completed
No Schooling Completed Comparison
Indonesians
Immigrants from Spain
3.2%
NO SCHOOLING COMPLETED
0.0/ 100
METRIC RATING
326th/ 347
METRIC RANK
2.0%
NO SCHOOLING COMPLETED
66.4/ 100
METRIC RATING
159th/ 347
METRIC RANK
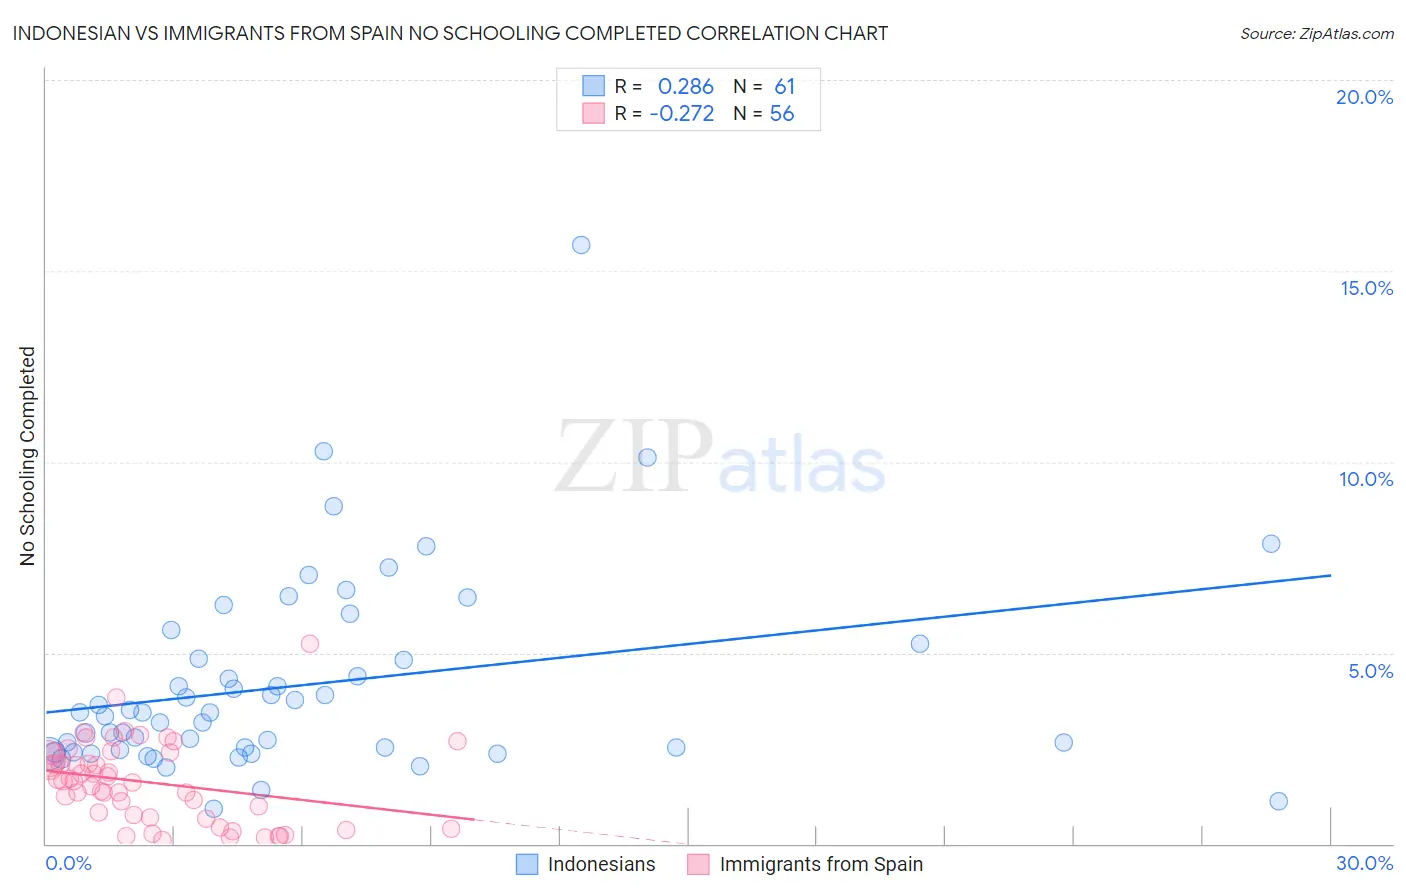
Indonesian vs Immigrants from Spain No Schooling Completed Correlation Chart
The statistical analysis conducted on geographies consisting of 162,153,140 people shows a weak positive correlation between the proportion of Indonesians and percentage of population with no schooling in the United States with a correlation coefficient (R) of 0.286 and weighted average of 3.2%. Similarly, the statistical analysis conducted on geographies consisting of 238,284,767 people shows a weak negative correlation between the proportion of Immigrants from Spain and percentage of population with no schooling in the United States with a correlation coefficient (R) of -0.272 and weighted average of 2.0%, a difference of 57.1%.
No Schooling Completed Correlation Summary
| Measurement | Indonesian | Immigrants from Spain |
| Minimum | 0.92% | 0.11% |
| Maximum | 15.7% | 5.2% |
| Range | 14.8% | 5.1% |
| Mean | 4.2% | 1.6% |
| Median | 3.4% | 1.6% |
| Interquartile 25% (IQ1) | 2.4% | 0.72% |
| Interquartile 75% (IQ3) | 5.0% | 2.3% |
| Interquartile Range (IQR) | 2.6% | 1.6% |
| Standard Deviation (Sample) | 2.6% | 1.0% |
| Standard Deviation (Population) | 2.6% | 1.0% |
Similar Demographics by No Schooling Completed
Demographics Similar to Indonesians by No Schooling Completed
In terms of no schooling completed, the demographic groups most similar to Indonesians are Dominican (3.2%, a difference of 0.030%), Mexican American Indian (3.2%, a difference of 0.70%), Vietnamese (3.2%, a difference of 1.1%), Immigrants from Honduras (3.2%, a difference of 1.2%), and Immigrants from Laos (3.1%, a difference of 1.9%).
| Demographics | Rating | Rank | No Schooling Completed |
| Immigrants | Burma/Myanmar | 0.0 /100 | #319 | Tragic 3.1% |
| Immigrants | Bangladesh | 0.0 /100 | #320 | Tragic 3.1% |
| Immigrants | Laos | 0.0 /100 | #321 | Tragic 3.1% |
| Immigrants | Honduras | 0.0 /100 | #322 | Tragic 3.2% |
| Vietnamese | 0.0 /100 | #323 | Tragic 3.2% |
| Mexican American Indians | 0.0 /100 | #324 | Tragic 3.2% |
| Dominicans | 0.0 /100 | #325 | Tragic 3.2% |
| Indonesians | 0.0 /100 | #326 | Tragic 3.2% |
| Immigrants | Latin America | 0.0 /100 | #327 | Tragic 3.3% |
| Mexicans | 0.0 /100 | #328 | Tragic 3.3% |
| Immigrants | Vietnam | 0.0 /100 | #329 | Tragic 3.3% |
| Immigrants | Armenia | 0.0 /100 | #330 | Tragic 3.3% |
| Japanese | 0.0 /100 | #331 | Tragic 3.3% |
| Central Americans | 0.0 /100 | #332 | Tragic 3.4% |
| Immigrants | Dominican Republic | 0.0 /100 | #333 | Tragic 3.4% |
Demographics Similar to Immigrants from Spain by No Schooling Completed
In terms of no schooling completed, the demographic groups most similar to Immigrants from Spain are Immigrants from Korea (2.0%, a difference of 0.050%), Immigrants from Sri Lanka (2.0%, a difference of 0.090%), Chilean (2.0%, a difference of 0.12%), Kenyan (2.0%, a difference of 0.12%), and Immigrants from Russia (2.0%, a difference of 0.19%).
| Demographics | Rating | Rank | No Schooling Completed |
| Immigrants | Eastern Europe | 70.4 /100 | #152 | Good 2.0% |
| Immigrants | Italy | 68.9 /100 | #153 | Good 2.0% |
| Immigrants | Venezuela | 68.5 /100 | #154 | Good 2.0% |
| Immigrants | Russia | 67.6 /100 | #155 | Good 2.0% |
| Chileans | 67.2 /100 | #156 | Good 2.0% |
| Immigrants | Sri Lanka | 67.0 /100 | #157 | Good 2.0% |
| Immigrants | Korea | 66.7 /100 | #158 | Good 2.0% |
| Immigrants | Spain | 66.4 /100 | #159 | Good 2.0% |
| Kenyans | 65.7 /100 | #160 | Good 2.0% |
| Ugandans | 64.6 /100 | #161 | Good 2.0% |
| Immigrants | Brazil | 63.8 /100 | #162 | Good 2.1% |
| Albanians | 62.2 /100 | #163 | Good 2.1% |
| Comanche | 60.7 /100 | #164 | Good 2.1% |
| Brazilians | 60.2 /100 | #165 | Good 2.1% |
| Dutch West Indians | 59.9 /100 | #166 | Average 2.1% |