Indonesian vs Nonimmigrants No Schooling Completed
COMPARE
Indonesian
Nonimmigrants
No Schooling Completed
No Schooling Completed Comparison
Indonesians
Nonimmigrants
3.2%
NO SCHOOLING COMPLETED
0.0/ 100
METRIC RATING
326th/ 347
METRIC RANK
1.8%
NO SCHOOLING COMPLETED
98.5/ 100
METRIC RATING
94th/ 347
METRIC RANK
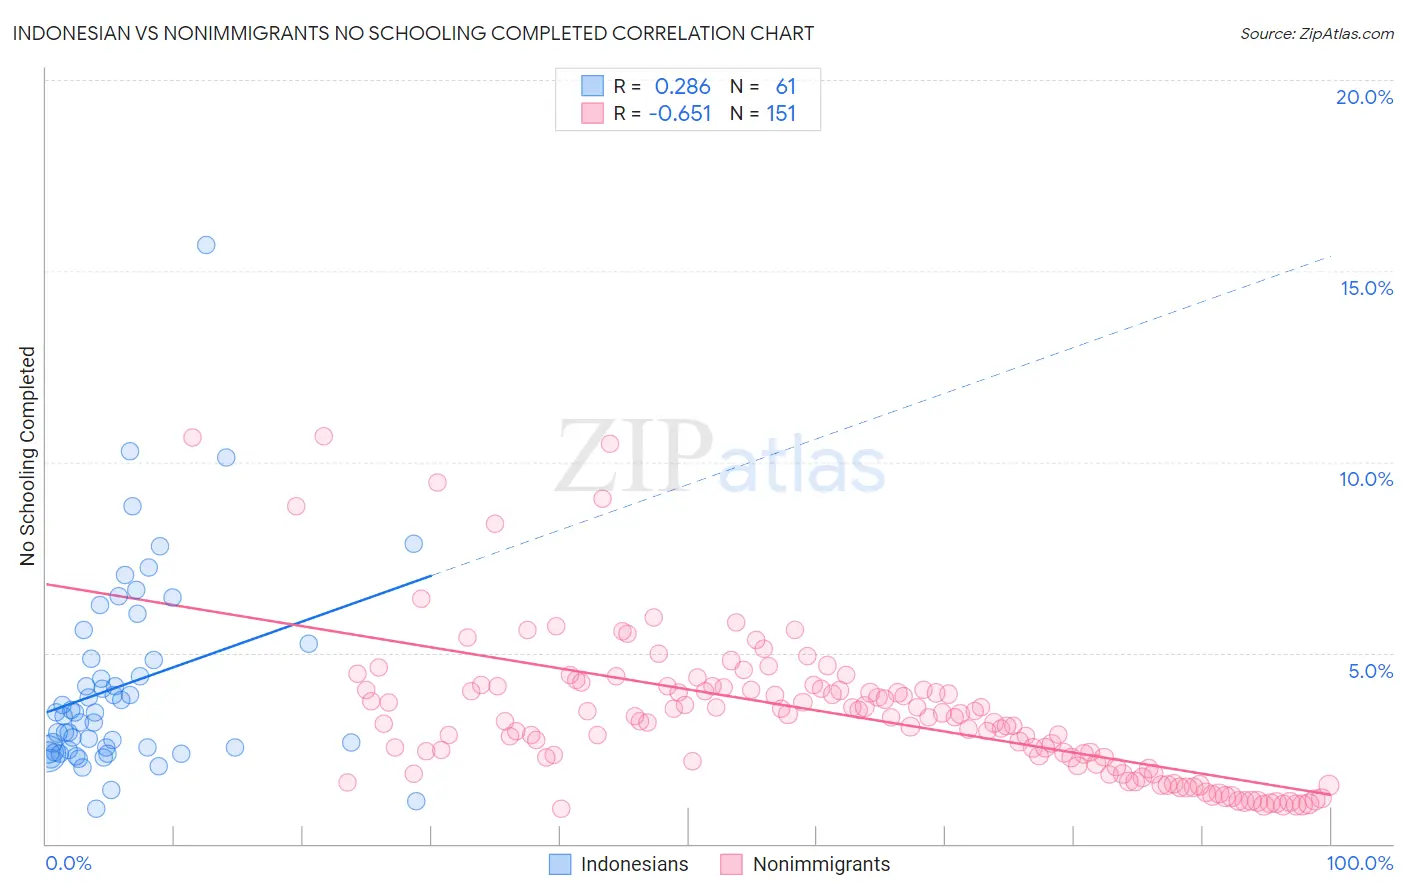
Indonesian vs Nonimmigrants No Schooling Completed Correlation Chart
The statistical analysis conducted on geographies consisting of 162,153,140 people shows a weak positive correlation between the proportion of Indonesians and percentage of population with no schooling in the United States with a correlation coefficient (R) of 0.286 and weighted average of 3.2%. Similarly, the statistical analysis conducted on geographies consisting of 562,676,251 people shows a significant negative correlation between the proportion of Nonimmigrants and percentage of population with no schooling in the United States with a correlation coefficient (R) of -0.651 and weighted average of 1.8%, a difference of 78.7%.
No Schooling Completed Correlation Summary
| Measurement | Indonesian | Nonimmigrants |
| Minimum | 0.92% | 0.93% |
| Maximum | 15.7% | 10.7% |
| Range | 14.8% | 9.8% |
| Mean | 4.2% | 3.4% |
| Median | 3.4% | 3.3% |
| Interquartile 25% (IQ1) | 2.4% | 2.0% |
| Interquartile 75% (IQ3) | 5.0% | 4.1% |
| Interquartile Range (IQR) | 2.6% | 2.1% |
| Standard Deviation (Sample) | 2.6% | 1.9% |
| Standard Deviation (Population) | 2.6% | 1.9% |
Similar Demographics by No Schooling Completed
Demographics Similar to Indonesians by No Schooling Completed
In terms of no schooling completed, the demographic groups most similar to Indonesians are Dominican (3.2%, a difference of 0.030%), Mexican American Indian (3.2%, a difference of 0.70%), Vietnamese (3.2%, a difference of 1.1%), Immigrants from Honduras (3.2%, a difference of 1.2%), and Immigrants from Laos (3.1%, a difference of 1.9%).
| Demographics | Rating | Rank | No Schooling Completed |
| Immigrants | Burma/Myanmar | 0.0 /100 | #319 | Tragic 3.1% |
| Immigrants | Bangladesh | 0.0 /100 | #320 | Tragic 3.1% |
| Immigrants | Laos | 0.0 /100 | #321 | Tragic 3.1% |
| Immigrants | Honduras | 0.0 /100 | #322 | Tragic 3.2% |
| Vietnamese | 0.0 /100 | #323 | Tragic 3.2% |
| Mexican American Indians | 0.0 /100 | #324 | Tragic 3.2% |
| Dominicans | 0.0 /100 | #325 | Tragic 3.2% |
| Indonesians | 0.0 /100 | #326 | Tragic 3.2% |
| Immigrants | Latin America | 0.0 /100 | #327 | Tragic 3.3% |
| Mexicans | 0.0 /100 | #328 | Tragic 3.3% |
| Immigrants | Vietnam | 0.0 /100 | #329 | Tragic 3.3% |
| Immigrants | Armenia | 0.0 /100 | #330 | Tragic 3.3% |
| Japanese | 0.0 /100 | #331 | Tragic 3.3% |
| Central Americans | 0.0 /100 | #332 | Tragic 3.4% |
| Immigrants | Dominican Republic | 0.0 /100 | #333 | Tragic 3.4% |
Demographics Similar to Nonimmigrants by No Schooling Completed
In terms of no schooling completed, the demographic groups most similar to Nonimmigrants are Puget Sound Salish (1.8%, a difference of 0.010%), Bhutanese (1.8%, a difference of 0.24%), Immigrants from Ireland (1.8%, a difference of 0.42%), Turkish (1.8%, a difference of 0.50%), and Iranian (1.8%, a difference of 0.70%).
| Demographics | Rating | Rank | No Schooling Completed |
| Osage | 99.2 /100 | #87 | Exceptional 1.8% |
| Immigrants | Western Europe | 99.2 /100 | #88 | Exceptional 1.8% |
| South Africans | 99.1 /100 | #89 | Exceptional 1.8% |
| Sioux | 99.0 /100 | #90 | Exceptional 1.8% |
| Immigrants | Germany | 99.0 /100 | #91 | Exceptional 1.8% |
| Romanians | 98.8 /100 | #92 | Exceptional 1.8% |
| Turks | 98.7 /100 | #93 | Exceptional 1.8% |
| Immigrants | Nonimmigrants | 98.5 /100 | #94 | Exceptional 1.8% |
| Puget Sound Salish | 98.5 /100 | #95 | Exceptional 1.8% |
| Bhutanese | 98.4 /100 | #96 | Exceptional 1.8% |
| Immigrants | Ireland | 98.4 /100 | #97 | Exceptional 1.8% |
| Iranians | 98.2 /100 | #98 | Exceptional 1.8% |
| Choctaw | 98.1 /100 | #99 | Exceptional 1.8% |
| Immigrants | Singapore | 98.0 /100 | #100 | Exceptional 1.8% |
| Immigrants | Czechoslovakia | 97.9 /100 | #101 | Exceptional 1.8% |