Indonesian vs Russian No Schooling Completed
COMPARE
Indonesian
Russian
No Schooling Completed
No Schooling Completed Comparison
Indonesians
Russians
3.2%
NO SCHOOLING COMPLETED
0.0/ 100
METRIC RATING
326th/ 347
METRIC RANK
1.7%
NO SCHOOLING COMPLETED
99.8/ 100
METRIC RATING
63rd/ 347
METRIC RANK
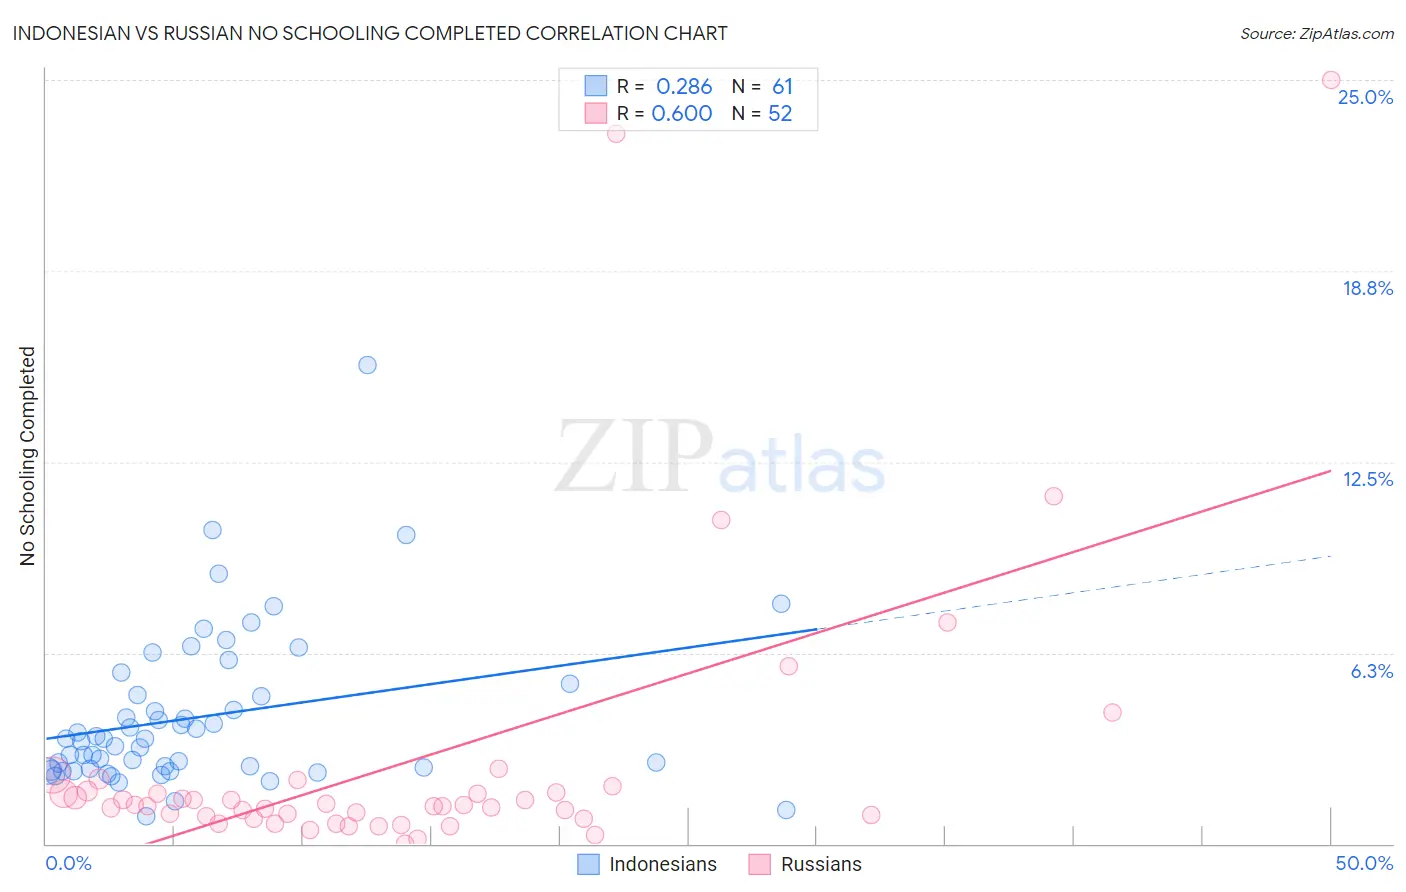
Indonesian vs Russian No Schooling Completed Correlation Chart
The statistical analysis conducted on geographies consisting of 162,153,140 people shows a weak positive correlation between the proportion of Indonesians and percentage of population with no schooling in the United States with a correlation coefficient (R) of 0.286 and weighted average of 3.2%. Similarly, the statistical analysis conducted on geographies consisting of 500,481,409 people shows a significant positive correlation between the proportion of Russians and percentage of population with no schooling in the United States with a correlation coefficient (R) of 0.600 and weighted average of 1.7%, a difference of 92.4%.
No Schooling Completed Correlation Summary
| Measurement | Indonesian | Russian |
| Minimum | 0.92% | 0.017% |
| Maximum | 15.7% | 25.0% |
| Range | 14.8% | 25.0% |
| Mean | 4.2% | 2.7% |
| Median | 3.4% | 1.3% |
| Interquartile 25% (IQ1) | 2.4% | 0.87% |
| Interquartile 75% (IQ3) | 5.0% | 1.7% |
| Interquartile Range (IQR) | 2.6% | 0.83% |
| Standard Deviation (Sample) | 2.6% | 4.9% |
| Standard Deviation (Population) | 2.6% | 4.8% |
Similar Demographics by No Schooling Completed
Demographics Similar to Indonesians by No Schooling Completed
In terms of no schooling completed, the demographic groups most similar to Indonesians are Dominican (3.2%, a difference of 0.030%), Mexican American Indian (3.2%, a difference of 0.70%), Vietnamese (3.2%, a difference of 1.1%), Immigrants from Honduras (3.2%, a difference of 1.2%), and Immigrants from Laos (3.1%, a difference of 1.9%).
| Demographics | Rating | Rank | No Schooling Completed |
| Immigrants | Burma/Myanmar | 0.0 /100 | #319 | Tragic 3.1% |
| Immigrants | Bangladesh | 0.0 /100 | #320 | Tragic 3.1% |
| Immigrants | Laos | 0.0 /100 | #321 | Tragic 3.1% |
| Immigrants | Honduras | 0.0 /100 | #322 | Tragic 3.2% |
| Vietnamese | 0.0 /100 | #323 | Tragic 3.2% |
| Mexican American Indians | 0.0 /100 | #324 | Tragic 3.2% |
| Dominicans | 0.0 /100 | #325 | Tragic 3.2% |
| Indonesians | 0.0 /100 | #326 | Tragic 3.2% |
| Immigrants | Latin America | 0.0 /100 | #327 | Tragic 3.3% |
| Mexicans | 0.0 /100 | #328 | Tragic 3.3% |
| Immigrants | Vietnam | 0.0 /100 | #329 | Tragic 3.3% |
| Immigrants | Armenia | 0.0 /100 | #330 | Tragic 3.3% |
| Japanese | 0.0 /100 | #331 | Tragic 3.3% |
| Central Americans | 0.0 /100 | #332 | Tragic 3.4% |
| Immigrants | Dominican Republic | 0.0 /100 | #333 | Tragic 3.4% |
Demographics Similar to Russians by No Schooling Completed
In terms of no schooling completed, the demographic groups most similar to Russians are Immigrants from Northern Europe (1.7%, a difference of 0.040%), New Zealander (1.7%, a difference of 0.16%), Serbian (1.7%, a difference of 0.20%), Canadian (1.7%, a difference of 0.34%), and Immigrants from Austria (1.7%, a difference of 0.53%).
| Demographics | Rating | Rank | No Schooling Completed |
| Immigrants | North America | 99.8 /100 | #56 | Exceptional 1.6% |
| Austrians | 99.8 /100 | #57 | Exceptional 1.6% |
| Kiowa | 99.8 /100 | #58 | Exceptional 1.6% |
| Slavs | 99.8 /100 | #59 | Exceptional 1.7% |
| Americans | 99.8 /100 | #60 | Exceptional 1.7% |
| Tsimshian | 99.8 /100 | #61 | Exceptional 1.7% |
| Immigrants | Northern Europe | 99.8 /100 | #62 | Exceptional 1.7% |
| Russians | 99.8 /100 | #63 | Exceptional 1.7% |
| New Zealanders | 99.7 /100 | #64 | Exceptional 1.7% |
| Serbians | 99.7 /100 | #65 | Exceptional 1.7% |
| Canadians | 99.7 /100 | #66 | Exceptional 1.7% |
| Immigrants | Austria | 99.7 /100 | #67 | Exceptional 1.7% |
| Immigrants | Lithuania | 99.7 /100 | #68 | Exceptional 1.7% |
| Chickasaw | 99.6 /100 | #69 | Exceptional 1.7% |
| Immigrants | Netherlands | 99.6 /100 | #70 | Exceptional 1.7% |