Indonesian vs Immigrants from Norway Associate's Degree
COMPARE
Indonesian
Immigrants from Norway
Associate's Degree
Associate's Degree Comparison
Indonesians
Immigrants from Norway
41.9%
ASSOCIATE'S DEGREE
0.6/ 100
METRIC RATING
253rd/ 347
METRIC RANK
52.2%
ASSOCIATE'S DEGREE
99.9/ 100
METRIC RATING
48th/ 347
METRIC RANK
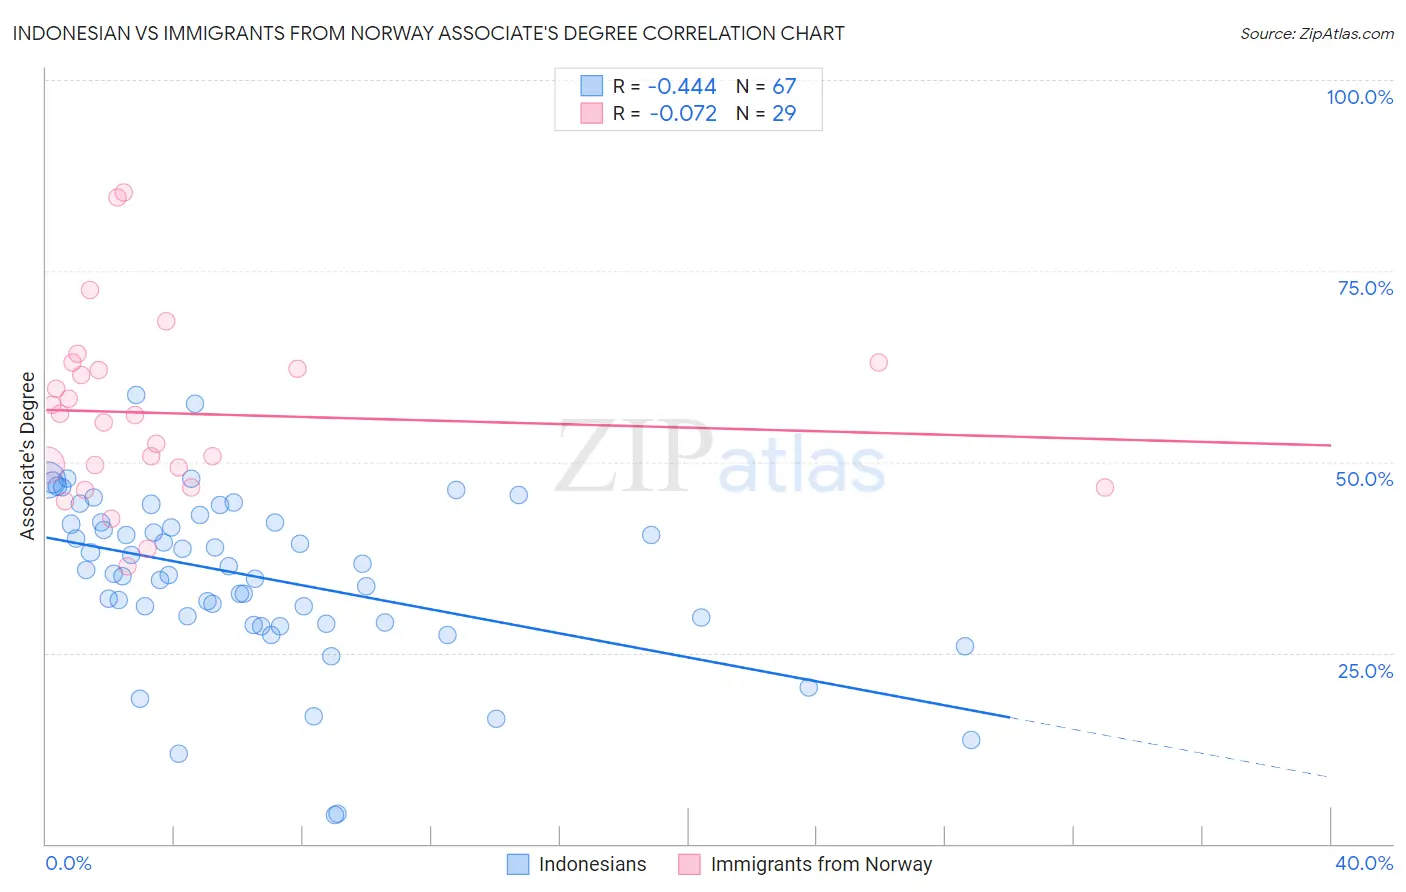
Indonesian vs Immigrants from Norway Associate's Degree Correlation Chart
The statistical analysis conducted on geographies consisting of 162,722,822 people shows a moderate negative correlation between the proportion of Indonesians and percentage of population with at least associate's degree education in the United States with a correlation coefficient (R) of -0.444 and weighted average of 41.9%. Similarly, the statistical analysis conducted on geographies consisting of 116,713,778 people shows a slight negative correlation between the proportion of Immigrants from Norway and percentage of population with at least associate's degree education in the United States with a correlation coefficient (R) of -0.072 and weighted average of 52.2%, a difference of 24.6%.
Associate's Degree Correlation Summary
| Measurement | Indonesian | Immigrants from Norway |
| Minimum | 3.8% | 36.3% |
| Maximum | 58.7% | 85.3% |
| Range | 54.9% | 49.0% |
| Mean | 35.0% | 56.3% |
| Median | 35.9% | 56.2% |
| Interquartile 25% (IQ1) | 29.0% | 47.9% |
| Interquartile 75% (IQ3) | 42.1% | 62.6% |
| Interquartile Range (IQR) | 13.1% | 14.7% |
| Standard Deviation (Sample) | 11.0% | 11.7% |
| Standard Deviation (Population) | 10.9% | 11.5% |
Similar Demographics by Associate's Degree
Demographics Similar to Indonesians by Associate's Degree
In terms of associate's degree, the demographic groups most similar to Indonesians are Cuban (41.9%, a difference of 0.060%), French American Indian (42.0%, a difference of 0.10%), Immigrants from Guyana (41.8%, a difference of 0.15%), Immigrants from Congo (41.8%, a difference of 0.28%), and Spanish American (41.8%, a difference of 0.34%).
| Demographics | Rating | Rank | Associate's Degree |
| Delaware | 0.9 /100 | #246 | Tragic 42.3% |
| Immigrants | Fiji | 0.8 /100 | #247 | Tragic 42.2% |
| Immigrants | Ecuador | 0.8 /100 | #248 | Tragic 42.2% |
| Jamaicans | 0.7 /100 | #249 | Tragic 42.1% |
| U.S. Virgin Islanders | 0.7 /100 | #250 | Tragic 42.1% |
| Immigrants | Bahamas | 0.7 /100 | #251 | Tragic 42.1% |
| French American Indians | 0.6 /100 | #252 | Tragic 42.0% |
| Indonesians | 0.6 /100 | #253 | Tragic 41.9% |
| Cubans | 0.6 /100 | #254 | Tragic 41.9% |
| Immigrants | Guyana | 0.5 /100 | #255 | Tragic 41.8% |
| Immigrants | Congo | 0.5 /100 | #256 | Tragic 41.8% |
| Spanish Americans | 0.5 /100 | #257 | Tragic 41.8% |
| Japanese | 0.5 /100 | #258 | Tragic 41.7% |
| Malaysians | 0.4 /100 | #259 | Tragic 41.6% |
| Marshallese | 0.4 /100 | #260 | Tragic 41.6% |
Demographics Similar to Immigrants from Norway by Associate's Degree
In terms of associate's degree, the demographic groups most similar to Immigrants from Norway are Immigrants from Austria (52.1%, a difference of 0.20%), Asian (52.1%, a difference of 0.21%), Immigrants from Kuwait (52.4%, a difference of 0.26%), Immigrants from Bulgaria (52.4%, a difference of 0.27%), and Immigrants from Greece (52.1%, a difference of 0.29%).
| Demographics | Rating | Rank | Associate's Degree |
| Immigrants | Saudi Arabia | 99.9 /100 | #41 | Exceptional 52.6% |
| Immigrants | Malaysia | 99.9 /100 | #42 | Exceptional 52.5% |
| Immigrants | South Africa | 99.9 /100 | #43 | Exceptional 52.5% |
| Estonians | 99.9 /100 | #44 | Exceptional 52.5% |
| Immigrants | Lithuania | 99.9 /100 | #45 | Exceptional 52.4% |
| Immigrants | Bulgaria | 99.9 /100 | #46 | Exceptional 52.4% |
| Immigrants | Kuwait | 99.9 /100 | #47 | Exceptional 52.4% |
| Immigrants | Norway | 99.9 /100 | #48 | Exceptional 52.2% |
| Immigrants | Austria | 99.9 /100 | #49 | Exceptional 52.1% |
| Asians | 99.9 /100 | #50 | Exceptional 52.1% |
| Immigrants | Greece | 99.9 /100 | #51 | Exceptional 52.1% |
| Bolivians | 99.8 /100 | #52 | Exceptional 52.0% |
| Immigrants | Asia | 99.8 /100 | #53 | Exceptional 52.0% |
| Immigrants | Spain | 99.8 /100 | #54 | Exceptional 51.9% |
| Australians | 99.8 /100 | #55 | Exceptional 51.9% |