Immigrants vs Somali 7th Grade
COMPARE
Immigrants
Somali
7th Grade
7th Grade Comparison
Immigrants
Somalis
94.0%
7TH GRADE
0.0/ 100
METRIC RATING
312th/ 347
METRIC RANK
95.3%
7TH GRADE
0.9/ 100
METRIC RATING
253rd/ 347
METRIC RANK
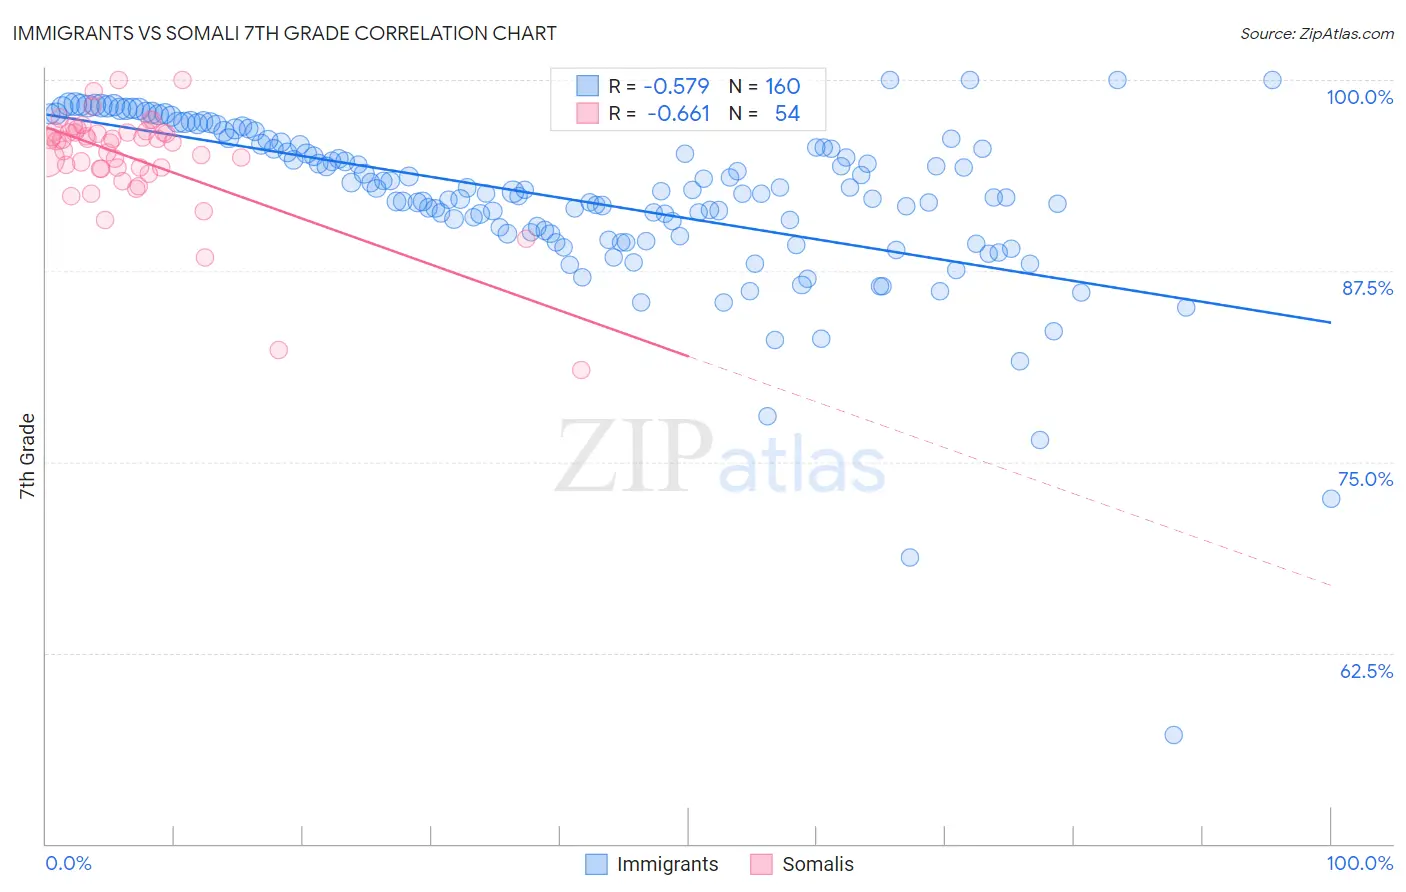
Immigrants vs Somali 7th Grade Correlation Chart
The statistical analysis conducted on geographies consisting of 577,787,402 people shows a substantial negative correlation between the proportion of Immigrants and percentage of population with at least 7th grade education in the United States with a correlation coefficient (R) of -0.579 and weighted average of 94.0%. Similarly, the statistical analysis conducted on geographies consisting of 99,332,457 people shows a significant negative correlation between the proportion of Somalis and percentage of population with at least 7th grade education in the United States with a correlation coefficient (R) of -0.661 and weighted average of 95.3%, a difference of 1.4%.
7th Grade Correlation Summary
| Measurement | Immigrants | Somali |
| Minimum | 57.2% | 81.1% |
| Maximum | 100.0% | 100.0% |
| Range | 42.8% | 18.9% |
| Mean | 92.2% | 94.9% |
| Median | 92.7% | 95.9% |
| Interquartile 25% (IQ1) | 90.0% | 94.2% |
| Interquartile 75% (IQ3) | 95.8% | 96.5% |
| Interquartile Range (IQR) | 5.9% | 2.4% |
| Standard Deviation (Sample) | 5.7% | 3.4% |
| Standard Deviation (Population) | 5.7% | 3.4% |
Similar Demographics by 7th Grade
Demographics Similar to Immigrants by 7th Grade
In terms of 7th grade, the demographic groups most similar to Immigrants are Immigrants from Bangladesh (94.0%, a difference of 0.0%), Japanese (94.0%, a difference of 0.030%), Puerto Rican (94.0%, a difference of 0.040%), Immigrants from Caribbean (94.0%, a difference of 0.050%), and Ecuadorian (94.0%, a difference of 0.060%).
| Demographics | Rating | Rank | 7th Grade |
| Guyanese | 0.0 /100 | #305 | Tragic 94.3% |
| Immigrants | Guyana | 0.0 /100 | #306 | Tragic 94.2% |
| Immigrants | Portugal | 0.0 /100 | #307 | Tragic 94.2% |
| Cape Verdeans | 0.0 /100 | #308 | Tragic 94.1% |
| Ecuadorians | 0.0 /100 | #309 | Tragic 94.0% |
| Immigrants | Caribbean | 0.0 /100 | #310 | Tragic 94.0% |
| Puerto Ricans | 0.0 /100 | #311 | Tragic 94.0% |
| Immigrants | Immigrants | 0.0 /100 | #312 | Tragic 94.0% |
| Immigrants | Bangladesh | 0.0 /100 | #313 | Tragic 94.0% |
| Japanese | 0.0 /100 | #314 | Tragic 94.0% |
| Vietnamese | 0.0 /100 | #315 | Tragic 93.9% |
| Immigrants | Vietnam | 0.0 /100 | #316 | Tragic 93.9% |
| Immigrants | Cuba | 0.0 /100 | #317 | Tragic 93.8% |
| Immigrants | Ecuador | 0.0 /100 | #318 | Tragic 93.7% |
| Immigrants | Cambodia | 0.0 /100 | #319 | Tragic 93.7% |
Demographics Similar to Somalis by 7th Grade
In terms of 7th grade, the demographic groups most similar to Somalis are Immigrants from Cameroon (95.4%, a difference of 0.010%), Immigrants from Jamaica (95.4%, a difference of 0.010%), Immigrants from Ethiopia (95.3%, a difference of 0.010%), Colombian (95.3%, a difference of 0.010%), and Korean (95.3%, a difference of 0.020%).
| Demographics | Rating | Rank | 7th Grade |
| Ethiopians | 1.5 /100 | #246 | Tragic 95.4% |
| Tongans | 1.3 /100 | #247 | Tragic 95.4% |
| Paiute | 1.2 /100 | #248 | Tragic 95.4% |
| Bolivians | 1.1 /100 | #249 | Tragic 95.4% |
| Immigrants | Cameroon | 0.9 /100 | #250 | Tragic 95.4% |
| Immigrants | Jamaica | 0.9 /100 | #251 | Tragic 95.4% |
| Immigrants | Ethiopia | 0.9 /100 | #252 | Tragic 95.3% |
| Somalis | 0.9 /100 | #253 | Tragic 95.3% |
| Colombians | 0.8 /100 | #254 | Tragic 95.3% |
| Koreans | 0.8 /100 | #255 | Tragic 95.3% |
| Immigrants | China | 0.7 /100 | #256 | Tragic 95.3% |
| Immigrants | Congo | 0.7 /100 | #257 | Tragic 95.3% |
| Ghanaians | 0.7 /100 | #258 | Tragic 95.3% |
| Immigrants | Costa Rica | 0.6 /100 | #259 | Tragic 95.3% |
| Afghans | 0.5 /100 | #260 | Tragic 95.3% |