Immigrants vs Immigrants from Greece Family Households with Children
COMPARE
Immigrants
Immigrants from Greece
Family Households with Children
Family Households with Children Comparison
Immigrants
Immigrants from Greece
28.9%
FAMILY HOUSEHOLDS WITH CHILDREN
100.0/ 100
METRIC RATING
50th/ 347
METRIC RANK
26.0%
FAMILY HOUSEHOLDS WITH CHILDREN
0.0/ 100
METRIC RATING
322nd/ 347
METRIC RANK
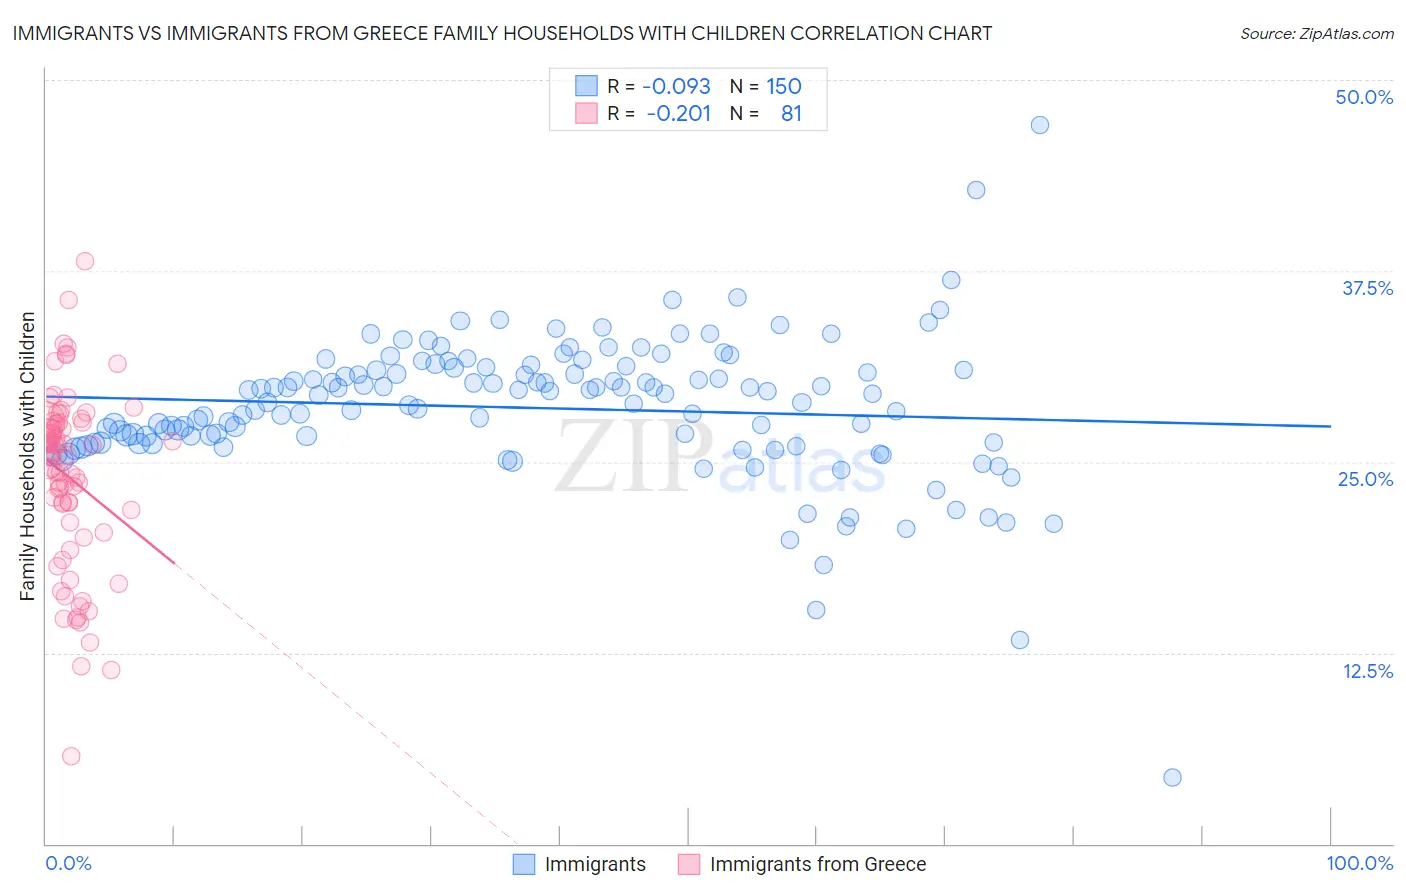
Immigrants vs Immigrants from Greece Family Households with Children Correlation Chart
The statistical analysis conducted on geographies consisting of 576,631,040 people shows a slight negative correlation between the proportion of Immigrants and percentage of family households with children in the United States with a correlation coefficient (R) of -0.093 and weighted average of 28.9%. Similarly, the statistical analysis conducted on geographies consisting of 216,757,437 people shows a weak negative correlation between the proportion of Immigrants from Greece and percentage of family households with children in the United States with a correlation coefficient (R) of -0.201 and weighted average of 26.0%, a difference of 11.2%.
Family Households with Children Correlation Summary
| Measurement | Immigrants | Immigrants from Greece |
| Minimum | 4.3% | 5.8% |
| Maximum | 47.1% | 38.1% |
| Range | 42.7% | 32.4% |
| Mean | 28.5% | 24.0% |
| Median | 29.1% | 25.4% |
| Interquartile 25% (IQ1) | 26.2% | 20.7% |
| Interquartile 75% (IQ3) | 31.0% | 27.6% |
| Interquartile Range (IQR) | 4.8% | 6.9% |
| Standard Deviation (Sample) | 4.7% | 5.9% |
| Standard Deviation (Population) | 4.7% | 5.9% |
Similar Demographics by Family Households with Children
Demographics Similar to Immigrants by Family Households with Children
In terms of family households with children, the demographic groups most similar to Immigrants are Immigrants from Peru (28.9%, a difference of 0.040%), Jordanian (29.0%, a difference of 0.11%), Guatemalan (28.9%, a difference of 0.11%), Immigrants from Cambodia (28.9%, a difference of 0.19%), and Apache (29.0%, a difference of 0.20%).
| Demographics | Rating | Rank | Family Households with Children |
| Asians | 100.0 /100 | #43 | Exceptional 29.1% |
| Immigrants | Taiwan | 100.0 /100 | #44 | Exceptional 29.0% |
| Fijians | 100.0 /100 | #45 | Exceptional 29.0% |
| Immigrants | Philippines | 100.0 /100 | #46 | Exceptional 29.0% |
| Peruvians | 100.0 /100 | #47 | Exceptional 29.0% |
| Apache | 100.0 /100 | #48 | Exceptional 29.0% |
| Jordanians | 100.0 /100 | #49 | Exceptional 29.0% |
| Immigrants | Immigrants | 100.0 /100 | #50 | Exceptional 28.9% |
| Immigrants | Peru | 100.0 /100 | #51 | Exceptional 28.9% |
| Guatemalans | 100.0 /100 | #52 | Exceptional 28.9% |
| Immigrants | Cambodia | 100.0 /100 | #53 | Exceptional 28.9% |
| Sierra Leoneans | 100.0 /100 | #54 | Exceptional 28.9% |
| Immigrants | Asia | 100.0 /100 | #55 | Exceptional 28.8% |
| Immigrants | Guatemala | 100.0 /100 | #56 | Exceptional 28.8% |
| Danes | 100.0 /100 | #57 | Exceptional 28.7% |
Demographics Similar to Immigrants from Greece by Family Households with Children
In terms of family households with children, the demographic groups most similar to Immigrants from Greece are British West Indian (26.0%, a difference of 0.010%), Tlingit-Haida (26.0%, a difference of 0.030%), Immigrants from Australia (26.0%, a difference of 0.030%), Immigrants from France (26.0%, a difference of 0.040%), and Chinese (26.0%, a difference of 0.070%).
| Demographics | Rating | Rank | Family Households with Children |
| Immigrants | Norway | 0.0 /100 | #315 | Tragic 26.1% |
| Estonians | 0.0 /100 | #316 | Tragic 26.1% |
| Ottawa | 0.0 /100 | #317 | Tragic 26.1% |
| Iroquois | 0.0 /100 | #318 | Tragic 26.1% |
| Immigrants | France | 0.0 /100 | #319 | Tragic 26.0% |
| Tlingit-Haida | 0.0 /100 | #320 | Tragic 26.0% |
| British West Indians | 0.0 /100 | #321 | Tragic 26.0% |
| Immigrants | Greece | 0.0 /100 | #322 | Tragic 26.0% |
| Immigrants | Australia | 0.0 /100 | #323 | Tragic 26.0% |
| Chinese | 0.0 /100 | #324 | Tragic 26.0% |
| Barbadians | 0.0 /100 | #325 | Tragic 26.0% |
| Immigrants | Ireland | 0.0 /100 | #326 | Tragic 26.0% |
| Immigrants | Barbados | 0.0 /100 | #327 | Tragic 26.0% |
| Immigrants | Albania | 0.0 /100 | #328 | Tragic 25.9% |
| Cypriots | 0.0 /100 | #329 | Tragic 25.9% |