Immigrants vs Nonimmigrants Bachelor's Degree
COMPARE
Immigrants
Nonimmigrants
Bachelor's Degree
Bachelor's Degree Comparison
Immigrants
Nonimmigrants
36.7%
BACHELOR'S DEGREE
22.8/ 100
METRIC RATING
204th/ 347
METRIC RANK
34.2%
BACHELOR'S DEGREE
1.8/ 100
METRIC RATING
242nd/ 347
METRIC RANK
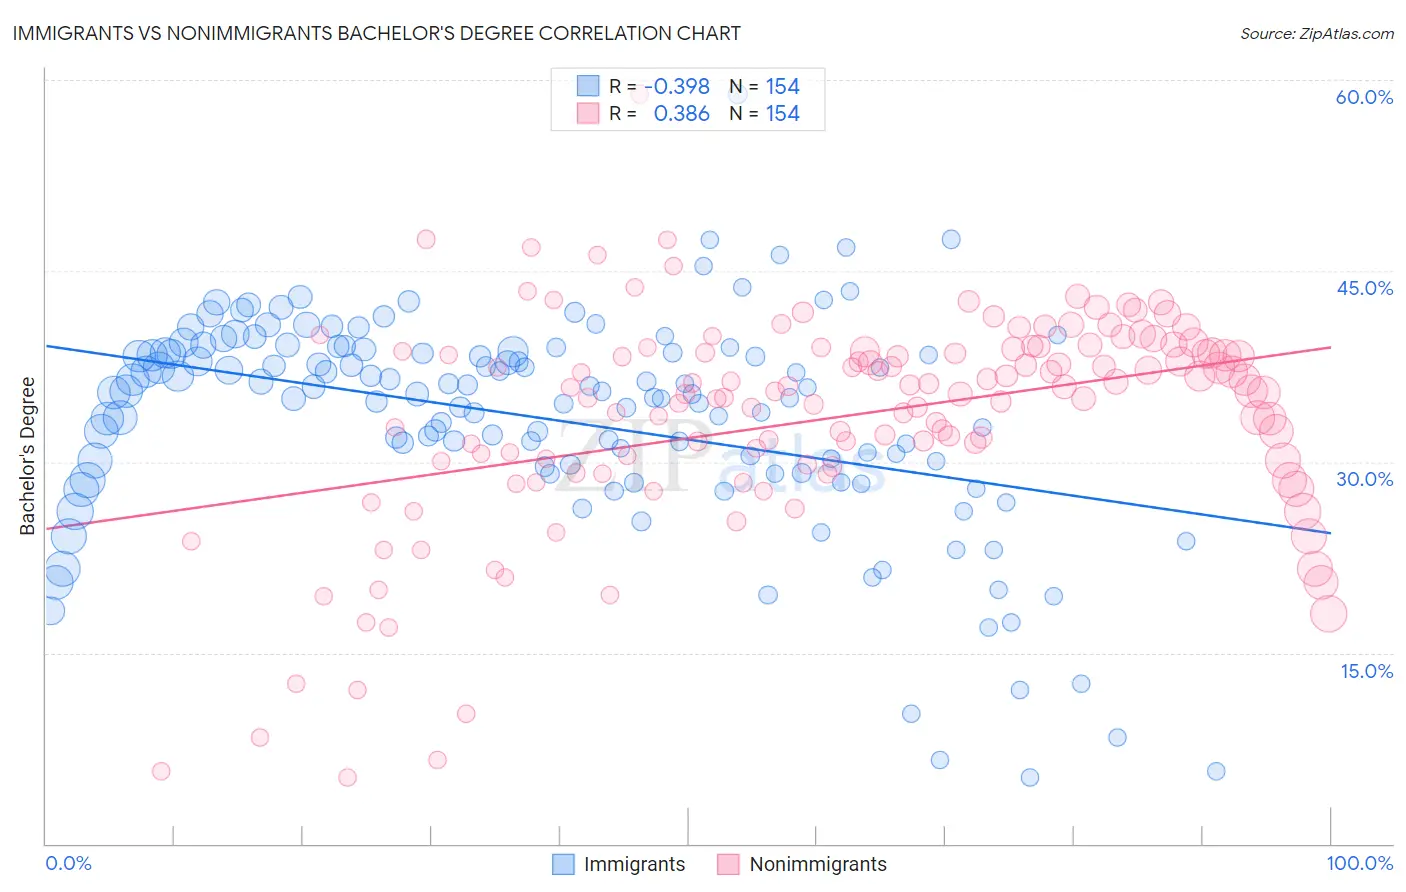
Immigrants vs Nonimmigrants Bachelor's Degree Correlation Chart
The statistical analysis conducted on geographies consisting of 577,535,120 people shows a mild negative correlation between the proportion of Immigrants and percentage of population with at least bachelor's degree education in the United States with a correlation coefficient (R) of -0.398 and weighted average of 36.7%. Similarly, the statistical analysis conducted on geographies consisting of 584,797,512 people shows a mild positive correlation between the proportion of Nonimmigrants and percentage of population with at least bachelor's degree education in the United States with a correlation coefficient (R) of 0.386 and weighted average of 34.2%, a difference of 7.5%.
Bachelor's Degree Correlation Summary
| Measurement | Immigrants | Nonimmigrants |
| Minimum | 5.2% | 5.2% |
| Maximum | 58.9% | 58.9% |
| Range | 53.7% | 53.7% |
| Mean | 33.4% | 33.4% |
| Median | 35.4% | 35.5% |
| Interquartile 25% (IQ1) | 29.6% | 29.8% |
| Interquartile 75% (IQ3) | 38.6% | 38.6% |
| Interquartile Range (IQR) | 9.0% | 8.9% |
| Standard Deviation (Sample) | 8.6% | 8.6% |
| Standard Deviation (Population) | 8.6% | 8.6% |
Similar Demographics by Bachelor's Degree
Demographics Similar to Immigrants by Bachelor's Degree
In terms of bachelor's degree, the demographic groups most similar to Immigrants are Immigrants from Nigeria (36.7%, a difference of 0.040%), Finnish (36.7%, a difference of 0.10%), Spaniard (36.6%, a difference of 0.24%), Immigrants from Zaire (36.8%, a difference of 0.33%), and Immigrants from Middle Africa (36.6%, a difference of 0.33%).
| Demographics | Rating | Rank | Bachelor's Degree |
| Czechoslovakians | 29.2 /100 | #197 | Fair 37.0% |
| Welsh | 29.1 /100 | #198 | Fair 37.0% |
| Immigrants | Costa Rica | 27.4 /100 | #199 | Fair 36.9% |
| Immigrants | Ghana | 27.4 /100 | #200 | Fair 36.9% |
| Immigrants | South Eastern Asia | 25.4 /100 | #201 | Fair 36.8% |
| Immigrants | Zaire | 25.3 /100 | #202 | Fair 36.8% |
| Immigrants | Nigeria | 23.1 /100 | #203 | Fair 36.7% |
| Immigrants | Immigrants | 22.8 /100 | #204 | Fair 36.7% |
| Finns | 22.2 /100 | #205 | Fair 36.7% |
| Spaniards | 21.2 /100 | #206 | Fair 36.6% |
| Immigrants | Middle Africa | 20.6 /100 | #207 | Fair 36.6% |
| Immigrants | Thailand | 19.4 /100 | #208 | Poor 36.5% |
| Panamanians | 18.8 /100 | #209 | Poor 36.5% |
| French | 18.6 /100 | #210 | Poor 36.5% |
| Scotch-Irish | 18.3 /100 | #211 | Poor 36.4% |
Demographics Similar to Nonimmigrants by Bachelor's Degree
In terms of bachelor's degree, the demographic groups most similar to Nonimmigrants are Immigrants from Cambodia (34.2%, a difference of 0.060%), Tongan (34.3%, a difference of 0.33%), Immigrants from Guyana (33.9%, a difference of 0.64%), British West Indian (34.5%, a difference of 0.87%), and Guyanese (34.5%, a difference of 0.89%).
| Demographics | Rating | Rank | Bachelor's Degree |
| Immigrants | West Indies | 2.9 /100 | #235 | Tragic 34.6% |
| Liberians | 2.8 /100 | #236 | Tragic 34.6% |
| Tlingit-Haida | 2.8 /100 | #237 | Tragic 34.6% |
| Guyanese | 2.5 /100 | #238 | Tragic 34.5% |
| British West Indians | 2.5 /100 | #239 | Tragic 34.5% |
| Tongans | 2.0 /100 | #240 | Tragic 34.3% |
| Immigrants | Cambodia | 1.9 /100 | #241 | Tragic 34.2% |
| Immigrants | Nonimmigrants | 1.8 /100 | #242 | Tragic 34.2% |
| Immigrants | Guyana | 1.4 /100 | #243 | Tragic 33.9% |
| Delaware | 1.2 /100 | #244 | Tragic 33.8% |
| Immigrants | Fiji | 1.2 /100 | #245 | Tragic 33.7% |
| Jamaicans | 1.0 /100 | #246 | Tragic 33.6% |
| Immigrants | Congo | 1.0 /100 | #247 | Tragic 33.6% |
| Cree | 1.0 /100 | #248 | Tragic 33.6% |
| Immigrants | Liberia | 0.9 /100 | #249 | Tragic 33.5% |