Immigrants vs Immigrants from Afghanistan Bachelor's Degree
COMPARE
Immigrants
Immigrants from Afghanistan
Bachelor's Degree
Bachelor's Degree Comparison
Immigrants
Immigrants from Afghanistan
36.7%
BACHELOR'S DEGREE
22.8/ 100
METRIC RATING
204th/ 347
METRIC RANK
39.1%
BACHELOR'S DEGREE
79.7/ 100
METRIC RATING
144th/ 347
METRIC RANK
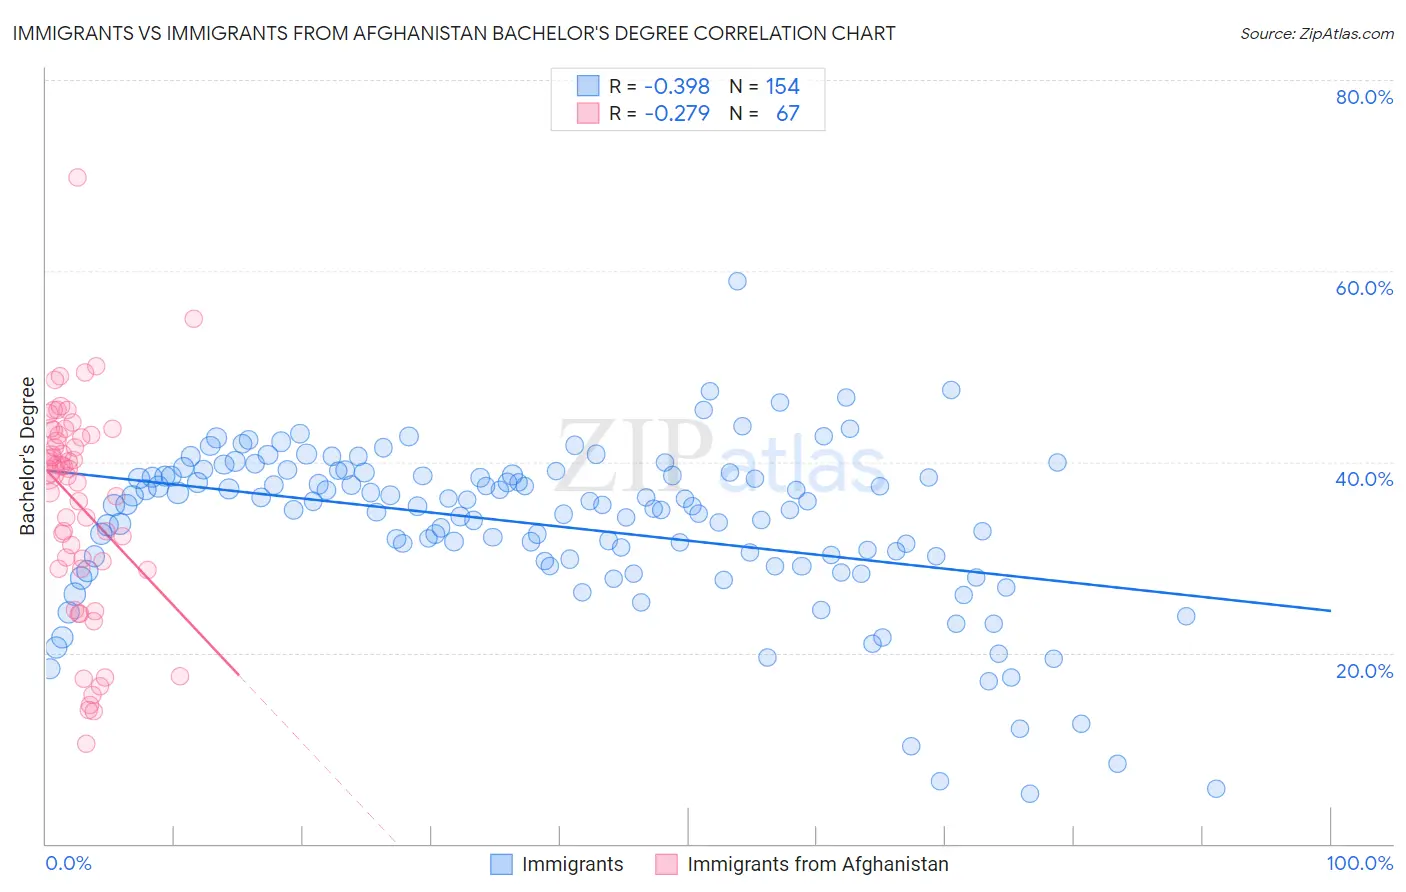
Immigrants vs Immigrants from Afghanistan Bachelor's Degree Correlation Chart
The statistical analysis conducted on geographies consisting of 577,535,120 people shows a mild negative correlation between the proportion of Immigrants and percentage of population with at least bachelor's degree education in the United States with a correlation coefficient (R) of -0.398 and weighted average of 36.7%. Similarly, the statistical analysis conducted on geographies consisting of 147,641,942 people shows a weak negative correlation between the proportion of Immigrants from Afghanistan and percentage of population with at least bachelor's degree education in the United States with a correlation coefficient (R) of -0.279 and weighted average of 39.1%, a difference of 6.5%.
Bachelor's Degree Correlation Summary
| Measurement | Immigrants | Immigrants from Afghanistan |
| Minimum | 5.2% | 10.5% |
| Maximum | 58.9% | 69.8% |
| Range | 53.7% | 59.3% |
| Mean | 33.4% | 35.6% |
| Median | 35.4% | 38.9% |
| Interquartile 25% (IQ1) | 29.6% | 28.9% |
| Interquartile 75% (IQ3) | 38.6% | 42.9% |
| Interquartile Range (IQR) | 9.0% | 14.0% |
| Standard Deviation (Sample) | 8.6% | 11.2% |
| Standard Deviation (Population) | 8.6% | 11.2% |
Similar Demographics by Bachelor's Degree
Demographics Similar to Immigrants by Bachelor's Degree
In terms of bachelor's degree, the demographic groups most similar to Immigrants are Immigrants from Nigeria (36.7%, a difference of 0.040%), Finnish (36.7%, a difference of 0.10%), Spaniard (36.6%, a difference of 0.24%), Immigrants from Zaire (36.8%, a difference of 0.33%), and Immigrants from Middle Africa (36.6%, a difference of 0.33%).
| Demographics | Rating | Rank | Bachelor's Degree |
| Czechoslovakians | 29.2 /100 | #197 | Fair 37.0% |
| Welsh | 29.1 /100 | #198 | Fair 37.0% |
| Immigrants | Costa Rica | 27.4 /100 | #199 | Fair 36.9% |
| Immigrants | Ghana | 27.4 /100 | #200 | Fair 36.9% |
| Immigrants | South Eastern Asia | 25.4 /100 | #201 | Fair 36.8% |
| Immigrants | Zaire | 25.3 /100 | #202 | Fair 36.8% |
| Immigrants | Nigeria | 23.1 /100 | #203 | Fair 36.7% |
| Immigrants | Immigrants | 22.8 /100 | #204 | Fair 36.7% |
| Finns | 22.2 /100 | #205 | Fair 36.7% |
| Spaniards | 21.2 /100 | #206 | Fair 36.6% |
| Immigrants | Middle Africa | 20.6 /100 | #207 | Fair 36.6% |
| Immigrants | Thailand | 19.4 /100 | #208 | Poor 36.5% |
| Panamanians | 18.8 /100 | #209 | Poor 36.5% |
| French | 18.6 /100 | #210 | Poor 36.5% |
| Scotch-Irish | 18.3 /100 | #211 | Poor 36.4% |
Demographics Similar to Immigrants from Afghanistan by Bachelor's Degree
In terms of bachelor's degree, the demographic groups most similar to Immigrants from Afghanistan are Polish (39.1%, a difference of 0.020%), Slovene (39.1%, a difference of 0.030%), Swedish (39.1%, a difference of 0.070%), Immigrants from Sierra Leone (39.0%, a difference of 0.10%), and Iraqi (39.0%, a difference of 0.24%).
| Demographics | Rating | Rank | Bachelor's Degree |
| Icelanders | 86.5 /100 | #137 | Excellent 39.5% |
| Europeans | 85.6 /100 | #138 | Excellent 39.5% |
| Immigrants | Sudan | 84.5 /100 | #139 | Excellent 39.4% |
| Immigrants | Armenia | 84.1 /100 | #140 | Excellent 39.4% |
| South American Indians | 83.6 /100 | #141 | Excellent 39.3% |
| Immigrants | North Macedonia | 81.6 /100 | #142 | Excellent 39.2% |
| Poles | 79.8 /100 | #143 | Good 39.1% |
| Immigrants | Afghanistan | 79.7 /100 | #144 | Good 39.1% |
| Slovenes | 79.5 /100 | #145 | Good 39.1% |
| Swedes | 79.2 /100 | #146 | Good 39.1% |
| Immigrants | Sierra Leone | 79.0 /100 | #147 | Good 39.0% |
| Iraqis | 78.1 /100 | #148 | Good 39.0% |
| Immigrants | Poland | 77.5 /100 | #149 | Good 39.0% |
| South Americans | 77.3 /100 | #150 | Good 38.9% |
| Immigrants | Africa | 76.5 /100 | #151 | Good 38.9% |