Immigrants from Netherlands vs Chilean 11th Grade
COMPARE
Immigrants from Netherlands
Chilean
11th Grade
11th Grade Comparison
Immigrants from Netherlands
Chileans
93.9%
11TH GRADE
99.8/ 100
METRIC RATING
67th/ 347
METRIC RANK
92.9%
11TH GRADE
83.0/ 100
METRIC RATING
141st/ 347
METRIC RANK
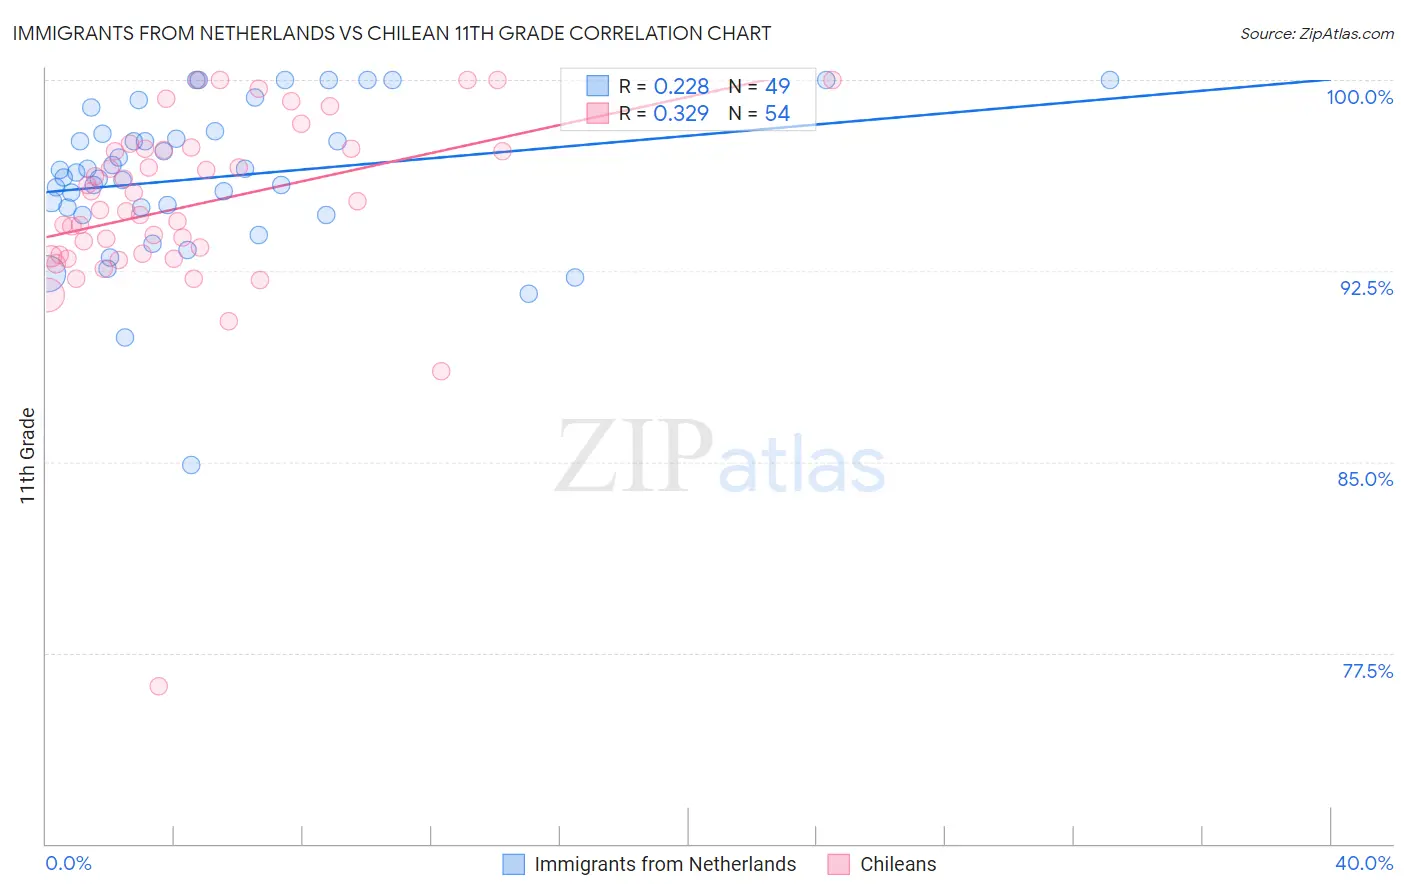
Immigrants from Netherlands vs Chilean 11th Grade Correlation Chart
The statistical analysis conducted on geographies consisting of 237,869,860 people shows a weak positive correlation between the proportion of Immigrants from Netherlands and percentage of population with at least 11th grade education in the United States with a correlation coefficient (R) of 0.228 and weighted average of 93.9%. Similarly, the statistical analysis conducted on geographies consisting of 256,683,580 people shows a mild positive correlation between the proportion of Chileans and percentage of population with at least 11th grade education in the United States with a correlation coefficient (R) of 0.329 and weighted average of 92.9%, a difference of 1.1%.
11th Grade Correlation Summary
| Measurement | Immigrants from Netherlands | Chilean |
| Minimum | 84.9% | 76.2% |
| Maximum | 100.0% | 100.0% |
| Range | 15.1% | 23.8% |
| Mean | 96.2% | 95.1% |
| Median | 96.4% | 95.1% |
| Interquartile 25% (IQ1) | 94.8% | 93.1% |
| Interquartile 75% (IQ3) | 97.9% | 97.3% |
| Interquartile Range (IQR) | 3.1% | 4.2% |
| Standard Deviation (Sample) | 3.0% | 3.8% |
| Standard Deviation (Population) | 3.0% | 3.7% |
Similar Demographics by 11th Grade
Demographics Similar to Immigrants from Netherlands by 11th Grade
In terms of 11th grade, the demographic groups most similar to Immigrants from Netherlands are Alaskan Athabascan (93.9%, a difference of 0.0%), Immigrants from Sweden (93.9%, a difference of 0.020%), Native Hawaiian (93.9%, a difference of 0.020%), Zimbabwean (93.9%, a difference of 0.020%), and Scotch-Irish (93.9%, a difference of 0.020%).
| Demographics | Rating | Rank | 11th Grade |
| Okinawans | 99.8 /100 | #60 | Exceptional 94.0% |
| Immigrants | Belgium | 99.8 /100 | #61 | Exceptional 94.0% |
| Austrians | 99.8 /100 | #62 | Exceptional 94.0% |
| Ukrainians | 99.8 /100 | #63 | Exceptional 94.0% |
| Immigrants | Sweden | 99.8 /100 | #64 | Exceptional 93.9% |
| Native Hawaiians | 99.8 /100 | #65 | Exceptional 93.9% |
| Alaskan Athabascans | 99.8 /100 | #66 | Exceptional 93.9% |
| Immigrants | Netherlands | 99.8 /100 | #67 | Exceptional 93.9% |
| Zimbabweans | 99.8 /100 | #68 | Exceptional 93.9% |
| Scotch-Irish | 99.8 /100 | #69 | Exceptional 93.9% |
| Immigrants | England | 99.7 /100 | #70 | Exceptional 93.8% |
| Immigrants | South Africa | 99.7 /100 | #71 | Exceptional 93.8% |
| Immigrants | Japan | 99.7 /100 | #72 | Exceptional 93.8% |
| Romanians | 99.6 /100 | #73 | Exceptional 93.8% |
| Immigrants | Czechoslovakia | 99.6 /100 | #74 | Exceptional 93.8% |
Demographics Similar to Chileans by 11th Grade
In terms of 11th grade, the demographic groups most similar to Chileans are Venezuelan (92.9%, a difference of 0.010%), Crow (92.9%, a difference of 0.020%), Kenyan (92.9%, a difference of 0.020%), Ugandan (92.9%, a difference of 0.030%), and Immigrants from Brazil (92.9%, a difference of 0.040%).
| Demographics | Rating | Rank | 11th Grade |
| Delaware | 87.3 /100 | #134 | Excellent 93.0% |
| Immigrants | Italy | 86.6 /100 | #135 | Excellent 92.9% |
| Cree | 85.9 /100 | #136 | Excellent 92.9% |
| Arabs | 85.4 /100 | #137 | Excellent 92.9% |
| Immigrants | Brazil | 85.1 /100 | #138 | Excellent 92.9% |
| Crow | 84.1 /100 | #139 | Excellent 92.9% |
| Venezuelans | 83.4 /100 | #140 | Excellent 92.9% |
| Chileans | 83.0 /100 | #141 | Excellent 92.9% |
| Kenyans | 82.0 /100 | #142 | Excellent 92.9% |
| Ugandans | 81.4 /100 | #143 | Excellent 92.9% |
| Assyrians/Chaldeans/Syriacs | 80.5 /100 | #144 | Excellent 92.8% |
| Pakistanis | 79.6 /100 | #145 | Good 92.8% |
| Iroquois | 79.1 /100 | #146 | Good 92.8% |
| Immigrants | Kenya | 78.7 /100 | #147 | Good 92.8% |
| Hmong | 78.6 /100 | #148 | Good 92.8% |