Bangladeshi vs Australian No Schooling Completed
COMPARE
Bangladeshi
Australian
No Schooling Completed
No Schooling Completed Comparison
Bangladeshis
Australians
3.5%
NO SCHOOLING COMPLETED
0.0/ 100
METRIC RATING
338th/ 347
METRIC RANK
1.6%
NO SCHOOLING COMPLETED
99.9/ 100
METRIC RATING
43rd/ 347
METRIC RANK
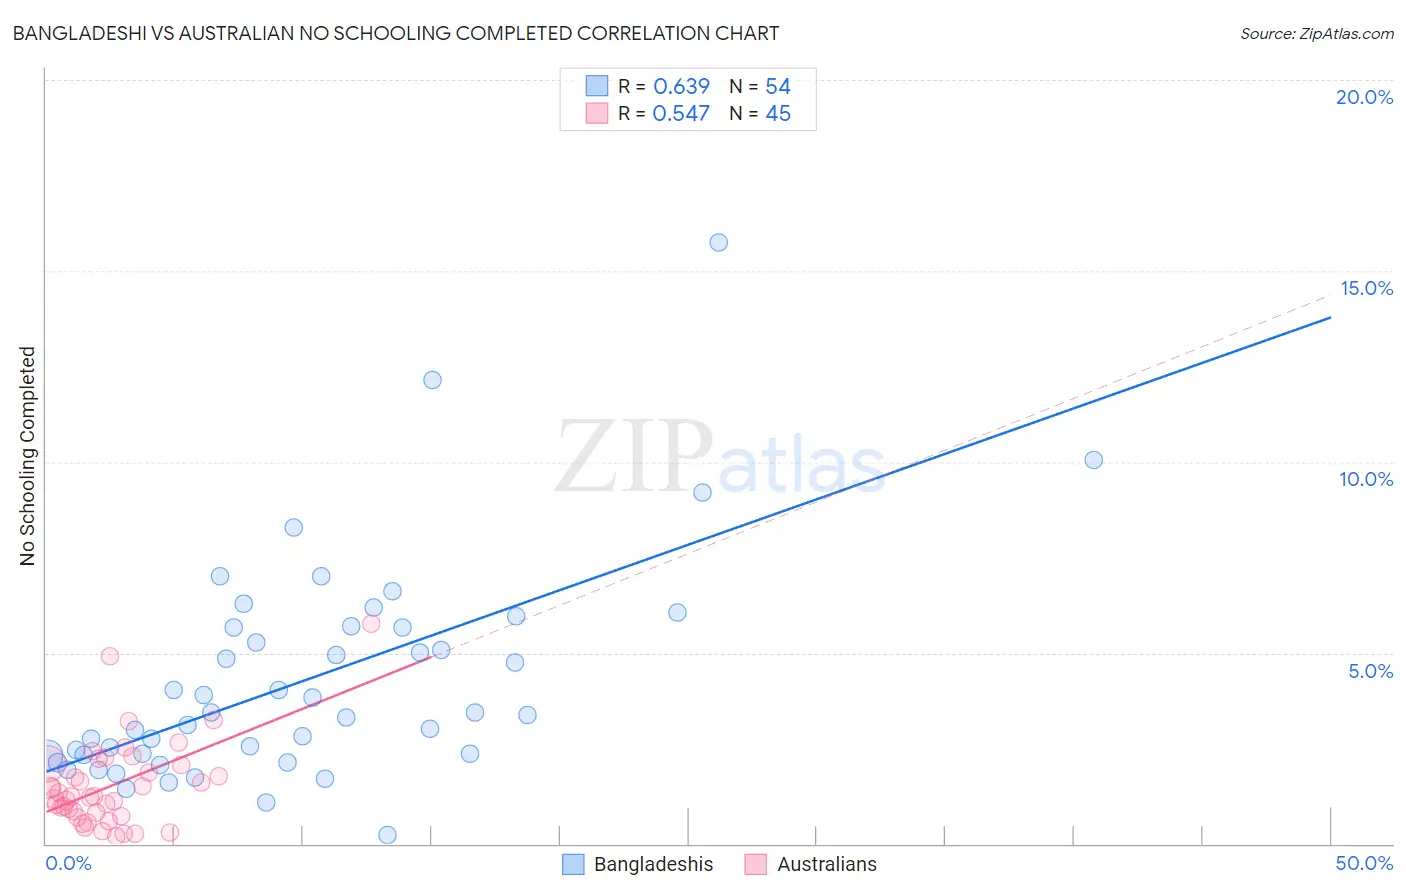
Bangladeshi vs Australian No Schooling Completed Correlation Chart
The statistical analysis conducted on geographies consisting of 140,674,207 people shows a significant positive correlation between the proportion of Bangladeshis and percentage of population with no schooling in the United States with a correlation coefficient (R) of 0.639 and weighted average of 3.5%. Similarly, the statistical analysis conducted on geographies consisting of 222,453,601 people shows a substantial positive correlation between the proportion of Australians and percentage of population with no schooling in the United States with a correlation coefficient (R) of 0.547 and weighted average of 1.6%, a difference of 118.9%.
No Schooling Completed Correlation Summary
| Measurement | Bangladeshi | Australian |
| Minimum | 0.24% | 0.20% |
| Maximum | 15.7% | 5.8% |
| Range | 15.5% | 5.6% |
| Mean | 4.3% | 1.5% |
| Median | 3.4% | 1.2% |
| Interquartile 25% (IQ1) | 2.3% | 0.77% |
| Interquartile 75% (IQ3) | 5.7% | 2.1% |
| Interquartile Range (IQR) | 3.3% | 1.3% |
| Standard Deviation (Sample) | 2.9% | 1.1% |
| Standard Deviation (Population) | 2.8% | 1.1% |
Similar Demographics by No Schooling Completed
Demographics Similar to Bangladeshis by No Schooling Completed
In terms of no schooling completed, the demographic groups most similar to Bangladeshis are Immigrants from Cabo Verde (3.5%, a difference of 0.23%), Yakama (3.6%, a difference of 0.31%), Immigrants from Fiji (3.5%, a difference of 0.95%), Immigrants from Guatemala (3.6%, a difference of 1.0%), and Immigrants from Cambodia (3.5%, a difference of 1.3%).
| Demographics | Rating | Rank | No Schooling Completed |
| Japanese | 0.0 /100 | #331 | Tragic 3.3% |
| Central Americans | 0.0 /100 | #332 | Tragic 3.4% |
| Immigrants | Dominican Republic | 0.0 /100 | #333 | Tragic 3.4% |
| Guatemalans | 0.0 /100 | #334 | Tragic 3.5% |
| Immigrants | Cambodia | 0.0 /100 | #335 | Tragic 3.5% |
| Immigrants | Fiji | 0.0 /100 | #336 | Tragic 3.5% |
| Immigrants | Cabo Verde | 0.0 /100 | #337 | Tragic 3.5% |
| Bangladeshis | 0.0 /100 | #338 | Tragic 3.5% |
| Yakama | 0.0 /100 | #339 | Tragic 3.6% |
| Immigrants | Guatemala | 0.0 /100 | #340 | Tragic 3.6% |
| Immigrants | Central America | 0.0 /100 | #341 | Tragic 3.6% |
| Immigrants | Mexico | 0.0 /100 | #342 | Tragic 3.6% |
| Salvadorans | 0.0 /100 | #343 | Tragic 3.7% |
| Nepalese | 0.0 /100 | #344 | Tragic 3.8% |
| Immigrants | El Salvador | 0.0 /100 | #345 | Tragic 3.9% |
Demographics Similar to Australians by No Schooling Completed
In terms of no schooling completed, the demographic groups most similar to Australians are Bulgarian (1.6%, a difference of 0.12%), Estonian (1.6%, a difference of 0.19%), Czechoslovakian (1.6%, a difference of 0.23%), Maltese (1.6%, a difference of 0.32%), and Ottawa (1.6%, a difference of 0.47%).
| Demographics | Rating | Rank | No Schooling Completed |
| Aleuts | 99.9 /100 | #36 | Exceptional 1.6% |
| Belgians | 99.9 /100 | #37 | Exceptional 1.6% |
| Northern Europeans | 99.9 /100 | #38 | Exceptional 1.6% |
| Native Hawaiians | 99.9 /100 | #39 | Exceptional 1.6% |
| Luxembourgers | 99.9 /100 | #40 | Exceptional 1.6% |
| Hungarians | 99.9 /100 | #41 | Exceptional 1.6% |
| Bulgarians | 99.9 /100 | #42 | Exceptional 1.6% |
| Australians | 99.9 /100 | #43 | Exceptional 1.6% |
| Estonians | 99.9 /100 | #44 | Exceptional 1.6% |
| Czechoslovakians | 99.9 /100 | #45 | Exceptional 1.6% |
| Maltese | 99.9 /100 | #46 | Exceptional 1.6% |
| Ottawa | 99.9 /100 | #47 | Exceptional 1.6% |
| Immigrants | Scotland | 99.9 /100 | #48 | Exceptional 1.6% |
| Whites/Caucasians | 99.9 /100 | #49 | Exceptional 1.6% |
| Celtics | 99.9 /100 | #50 | Exceptional 1.6% |