Immigrants from Zimbabwe vs Yuman Associate's Degree
COMPARE
Immigrants from Zimbabwe
Yuman
Associate's Degree
Associate's Degree Comparison
Immigrants from Zimbabwe
Yuman
50.5%
ASSOCIATE'S DEGREE
99.2/ 100
METRIC RATING
76th/ 347
METRIC RANK
31.3%
ASSOCIATE'S DEGREE
0.0/ 100
METRIC RATING
344th/ 347
METRIC RANK
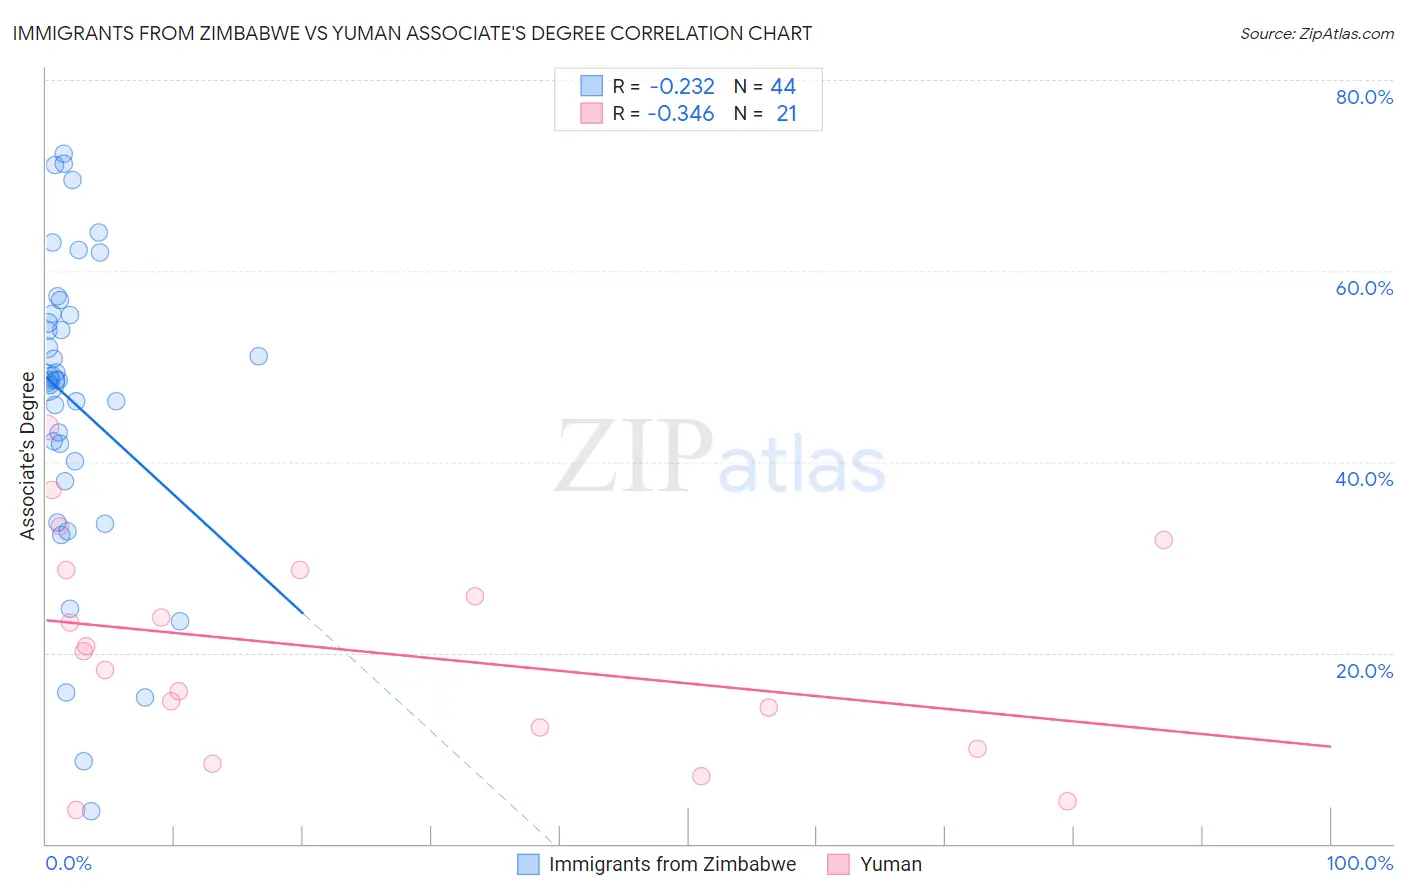
Immigrants from Zimbabwe vs Yuman Associate's Degree Correlation Chart
The statistical analysis conducted on geographies consisting of 117,809,864 people shows a weak negative correlation between the proportion of Immigrants from Zimbabwe and percentage of population with at least associate's degree education in the United States with a correlation coefficient (R) of -0.232 and weighted average of 50.5%. Similarly, the statistical analysis conducted on geographies consisting of 40,695,957 people shows a mild negative correlation between the proportion of Yuman and percentage of population with at least associate's degree education in the United States with a correlation coefficient (R) of -0.346 and weighted average of 31.3%, a difference of 61.6%.
Associate's Degree Correlation Summary
| Measurement | Immigrants from Zimbabwe | Yuman |
| Minimum | 3.5% | 3.5% |
| Maximum | 72.3% | 43.6% |
| Range | 68.9% | 40.1% |
| Mean | 46.2% | 20.3% |
| Median | 48.6% | 20.2% |
| Interquartile 25% (IQ1) | 39.0% | 11.1% |
| Interquartile 75% (IQ3) | 55.5% | 28.7% |
| Interquartile Range (IQR) | 16.4% | 17.6% |
| Standard Deviation (Sample) | 16.2% | 11.0% |
| Standard Deviation (Population) | 16.0% | 10.8% |
Similar Demographics by Associate's Degree
Demographics Similar to Immigrants from Zimbabwe by Associate's Degree
In terms of associate's degree, the demographic groups most similar to Immigrants from Zimbabwe are Immigrants from Lebanon (50.5%, a difference of 0.030%), Immigrants from Eastern Europe (50.5%, a difference of 0.080%), Ethiopian (50.4%, a difference of 0.090%), Armenian (50.4%, a difference of 0.12%), and Maltese (50.4%, a difference of 0.19%).
| Demographics | Rating | Rank | Associate's Degree |
| Egyptians | 99.5 /100 | #69 | Exceptional 50.9% |
| Immigrants | Argentina | 99.5 /100 | #70 | Exceptional 50.9% |
| Immigrants | Romania | 99.5 /100 | #71 | Exceptional 50.9% |
| Immigrants | Pakistan | 99.5 /100 | #72 | Exceptional 50.9% |
| Carpatho Rusyns | 99.3 /100 | #73 | Exceptional 50.6% |
| Lithuanians | 99.3 /100 | #74 | Exceptional 50.6% |
| Immigrants | Scotland | 99.3 /100 | #75 | Exceptional 50.6% |
| Immigrants | Zimbabwe | 99.2 /100 | #76 | Exceptional 50.5% |
| Immigrants | Lebanon | 99.1 /100 | #77 | Exceptional 50.5% |
| Immigrants | Eastern Europe | 99.1 /100 | #78 | Exceptional 50.5% |
| Ethiopians | 99.1 /100 | #79 | Exceptional 50.4% |
| Armenians | 99.1 /100 | #80 | Exceptional 50.4% |
| Maltese | 99.1 /100 | #81 | Exceptional 50.4% |
| Greeks | 98.9 /100 | #82 | Exceptional 50.3% |
| Immigrants | Uzbekistan | 98.9 /100 | #83 | Exceptional 50.3% |
Demographics Similar to Yuman by Associate's Degree
In terms of associate's degree, the demographic groups most similar to Yuman are Tohono O'odham (31.8%, a difference of 1.7%), Yakama (32.3%, a difference of 3.4%), Pima (30.2%, a difference of 3.4%), Inupiat (32.6%, a difference of 4.2%), and Navajo (32.6%, a difference of 4.3%).
| Demographics | Rating | Rank | Associate's Degree |
| Mexicans | 0.0 /100 | #333 | Tragic 35.0% |
| Natives/Alaskans | 0.0 /100 | #334 | Tragic 34.9% |
| Spanish American Indians | 0.0 /100 | #335 | Tragic 34.9% |
| Hopi | 0.0 /100 | #336 | Tragic 34.6% |
| Lumbee | 0.0 /100 | #337 | Tragic 34.1% |
| Pueblo | 0.0 /100 | #338 | Tragic 34.0% |
| Immigrants | Mexico | 0.0 /100 | #339 | Tragic 33.7% |
| Navajo | 0.0 /100 | #340 | Tragic 32.6% |
| Inupiat | 0.0 /100 | #341 | Tragic 32.6% |
| Yakama | 0.0 /100 | #342 | Tragic 32.3% |
| Tohono O'odham | 0.0 /100 | #343 | Tragic 31.8% |
| Yuman | 0.0 /100 | #344 | Tragic 31.3% |
| Pima | 0.0 /100 | #345 | Tragic 30.2% |
| Houma | 0.0 /100 | #346 | Tragic 28.2% |
| Yup'ik | 0.0 /100 | #347 | Tragic 25.0% |