Choctaw vs Yuman Associate's Degree
COMPARE
Choctaw
Yuman
Associate's Degree
Associate's Degree Comparison
Choctaw
Yuman
37.8%
ASSOCIATE'S DEGREE
0.0/ 100
METRIC RATING
312th/ 347
METRIC RANK
31.3%
ASSOCIATE'S DEGREE
0.0/ 100
METRIC RATING
344th/ 347
METRIC RANK
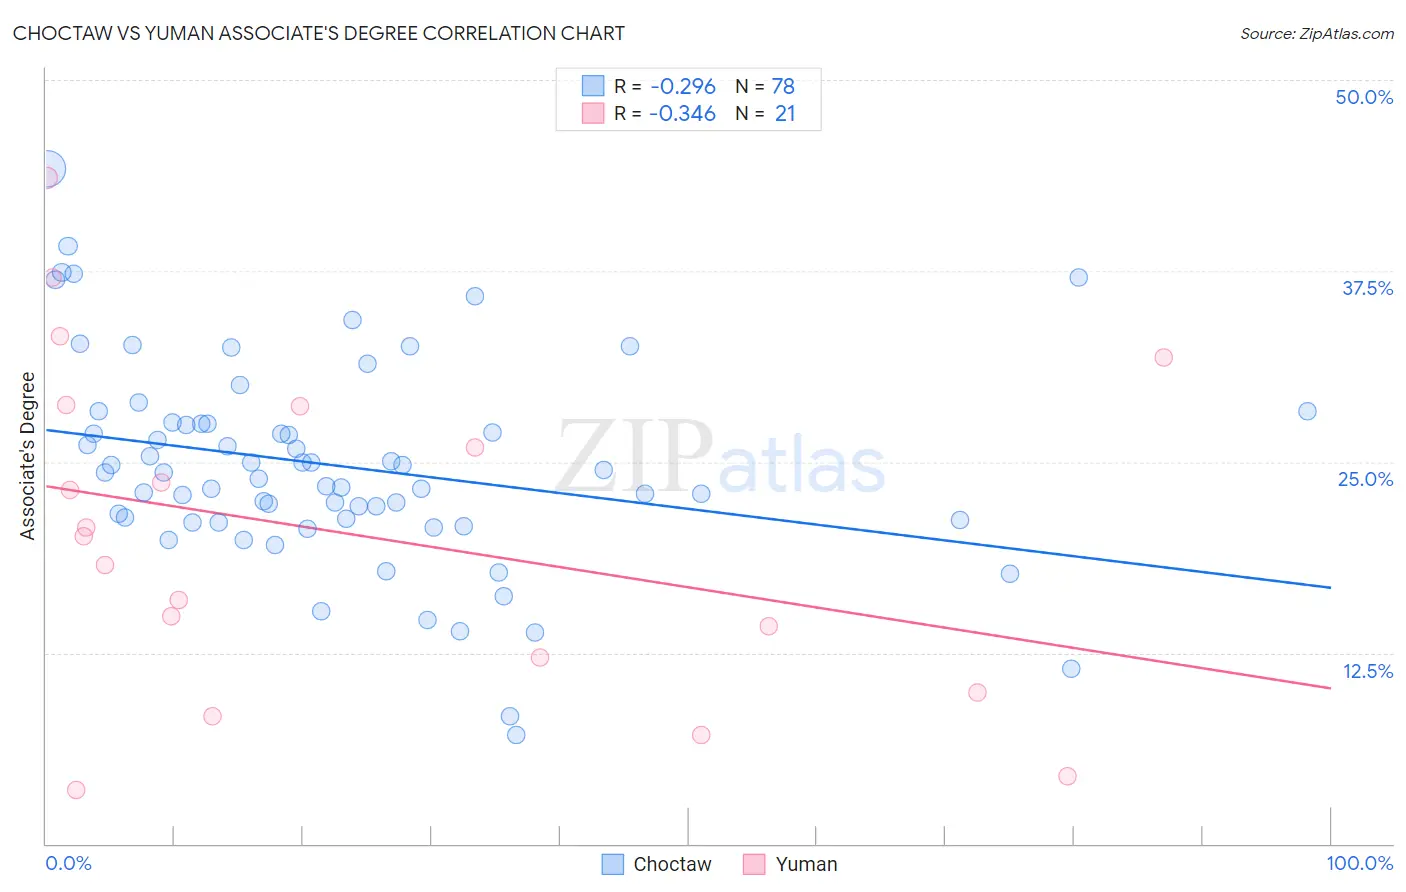
Choctaw vs Yuman Associate's Degree Correlation Chart
The statistical analysis conducted on geographies consisting of 269,730,992 people shows a weak negative correlation between the proportion of Choctaw and percentage of population with at least associate's degree education in the United States with a correlation coefficient (R) of -0.296 and weighted average of 37.8%. Similarly, the statistical analysis conducted on geographies consisting of 40,695,957 people shows a mild negative correlation between the proportion of Yuman and percentage of population with at least associate's degree education in the United States with a correlation coefficient (R) of -0.346 and weighted average of 31.3%, a difference of 20.9%.
Associate's Degree Correlation Summary
| Measurement | Choctaw | Yuman |
| Minimum | 7.1% | 3.5% |
| Maximum | 44.2% | 43.6% |
| Range | 37.1% | 40.1% |
| Mean | 24.7% | 20.3% |
| Median | 24.3% | 20.2% |
| Interquartile 25% (IQ1) | 21.2% | 11.1% |
| Interquartile 75% (IQ3) | 27.5% | 28.7% |
| Interquartile Range (IQR) | 6.3% | 17.6% |
| Standard Deviation (Sample) | 6.8% | 11.0% |
| Standard Deviation (Population) | 6.8% | 10.8% |
Similar Demographics by Associate's Degree
Demographics Similar to Choctaw by Associate's Degree
In terms of associate's degree, the demographic groups most similar to Choctaw are Hispanic or Latino (37.7%, a difference of 0.15%), Seminole (37.7%, a difference of 0.20%), Immigrants from Latin America (37.9%, a difference of 0.22%), Immigrants from Dominican Republic (37.9%, a difference of 0.33%), and Creek (37.6%, a difference of 0.59%).
| Demographics | Rating | Rank | Associate's Degree |
| Immigrants | Honduras | 0.0 /100 | #305 | Tragic 38.5% |
| Shoshone | 0.0 /100 | #306 | Tragic 38.4% |
| Immigrants | El Salvador | 0.0 /100 | #307 | Tragic 38.4% |
| Mexican American Indians | 0.0 /100 | #308 | Tragic 38.2% |
| Immigrants | Guatemala | 0.0 /100 | #309 | Tragic 38.1% |
| Immigrants | Dominican Republic | 0.0 /100 | #310 | Tragic 37.9% |
| Immigrants | Latin America | 0.0 /100 | #311 | Tragic 37.9% |
| Choctaw | 0.0 /100 | #312 | Tragic 37.8% |
| Hispanics or Latinos | 0.0 /100 | #313 | Tragic 37.7% |
| Seminole | 0.0 /100 | #314 | Tragic 37.7% |
| Creek | 0.0 /100 | #315 | Tragic 37.6% |
| Crow | 0.0 /100 | #316 | Tragic 37.6% |
| Yaqui | 0.0 /100 | #317 | Tragic 37.6% |
| Alaska Natives | 0.0 /100 | #318 | Tragic 37.5% |
| Fijians | 0.0 /100 | #319 | Tragic 37.4% |
Demographics Similar to Yuman by Associate's Degree
In terms of associate's degree, the demographic groups most similar to Yuman are Tohono O'odham (31.8%, a difference of 1.7%), Yakama (32.3%, a difference of 3.4%), Pima (30.2%, a difference of 3.4%), Inupiat (32.6%, a difference of 4.2%), and Navajo (32.6%, a difference of 4.3%).
| Demographics | Rating | Rank | Associate's Degree |
| Mexicans | 0.0 /100 | #333 | Tragic 35.0% |
| Natives/Alaskans | 0.0 /100 | #334 | Tragic 34.9% |
| Spanish American Indians | 0.0 /100 | #335 | Tragic 34.9% |
| Hopi | 0.0 /100 | #336 | Tragic 34.6% |
| Lumbee | 0.0 /100 | #337 | Tragic 34.1% |
| Pueblo | 0.0 /100 | #338 | Tragic 34.0% |
| Immigrants | Mexico | 0.0 /100 | #339 | Tragic 33.7% |
| Navajo | 0.0 /100 | #340 | Tragic 32.6% |
| Inupiat | 0.0 /100 | #341 | Tragic 32.6% |
| Yakama | 0.0 /100 | #342 | Tragic 32.3% |
| Tohono O'odham | 0.0 /100 | #343 | Tragic 31.8% |
| Yuman | 0.0 /100 | #344 | Tragic 31.3% |
| Pima | 0.0 /100 | #345 | Tragic 30.2% |
| Houma | 0.0 /100 | #346 | Tragic 28.2% |
| Yup'ik | 0.0 /100 | #347 | Tragic 25.0% |