Immigrants from Zimbabwe vs New Zealander Associate's Degree
COMPARE
Immigrants from Zimbabwe
New Zealander
Associate's Degree
Associate's Degree Comparison
Immigrants from Zimbabwe
New Zealanders
50.5%
ASSOCIATE'S DEGREE
99.2/ 100
METRIC RATING
76th/ 347
METRIC RANK
51.8%
ASSOCIATE'S DEGREE
99.8/ 100
METRIC RATING
58th/ 347
METRIC RANK
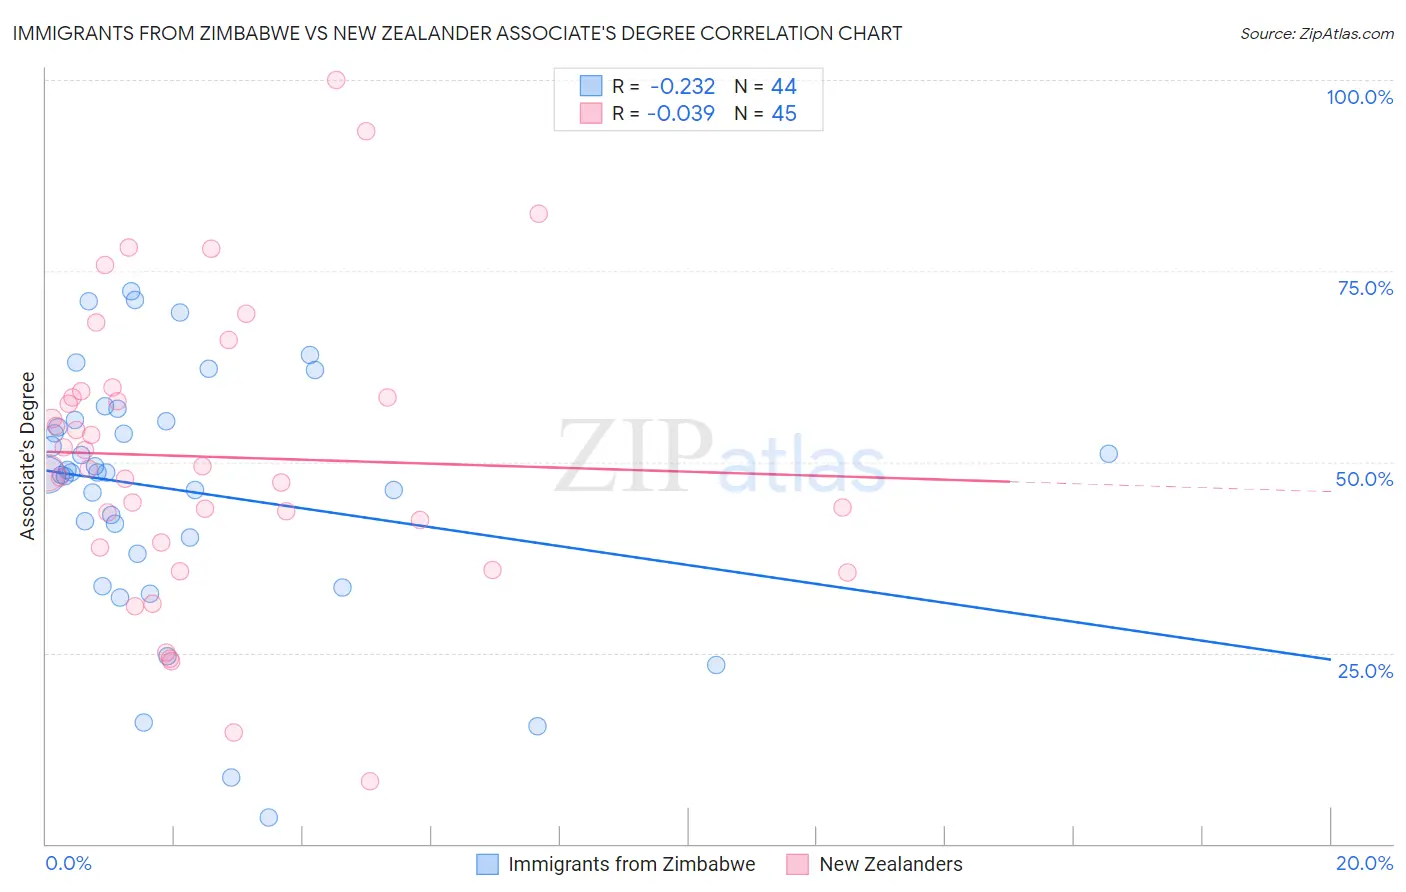
Immigrants from Zimbabwe vs New Zealander Associate's Degree Correlation Chart
The statistical analysis conducted on geographies consisting of 117,809,864 people shows a weak negative correlation between the proportion of Immigrants from Zimbabwe and percentage of population with at least associate's degree education in the United States with a correlation coefficient (R) of -0.232 and weighted average of 50.5%. Similarly, the statistical analysis conducted on geographies consisting of 106,916,688 people shows no correlation between the proportion of New Zealanders and percentage of population with at least associate's degree education in the United States with a correlation coefficient (R) of -0.039 and weighted average of 51.8%, a difference of 2.6%.
Associate's Degree Correlation Summary
| Measurement | Immigrants from Zimbabwe | New Zealander |
| Minimum | 3.5% | 8.2% |
| Maximum | 72.3% | 100.0% |
| Range | 68.9% | 91.8% |
| Mean | 46.2% | 50.7% |
| Median | 48.6% | 49.1% |
| Interquartile 25% (IQ1) | 39.0% | 39.1% |
| Interquartile 75% (IQ3) | 55.5% | 58.9% |
| Interquartile Range (IQR) | 16.4% | 19.8% |
| Standard Deviation (Sample) | 16.2% | 19.0% |
| Standard Deviation (Population) | 16.0% | 18.8% |
Demographics Similar to Immigrants from Zimbabwe and New Zealanders by Associate's Degree
In terms of associate's degree, the demographic groups most similar to Immigrants from Zimbabwe are Immigrants from Lebanon (50.5%, a difference of 0.030%), Immigrants from Scotland (50.6%, a difference of 0.21%), Lithuanian (50.6%, a difference of 0.25%), Carpatho Rusyn (50.6%, a difference of 0.31%), and Immigrants from Pakistan (50.9%, a difference of 0.77%). Similarly, the demographic groups most similar to New Zealanders are Paraguayan (51.8%, a difference of 0.030%), Immigrants from Serbia (51.7%, a difference of 0.13%), Immigrants from Bolivia (51.5%, a difference of 0.58%), Immigrants from Kazakhstan (51.4%, a difference of 0.73%), and Bhutanese (51.4%, a difference of 0.74%).
| Demographics | Rating | Rank | Associate's Degree |
| Paraguayans | 99.8 /100 | #57 | Exceptional 51.8% |
| New Zealanders | 99.8 /100 | #58 | Exceptional 51.8% |
| Immigrants | Serbia | 99.8 /100 | #59 | Exceptional 51.7% |
| Immigrants | Bolivia | 99.7 /100 | #60 | Exceptional 51.5% |
| Immigrants | Kazakhstan | 99.7 /100 | #61 | Exceptional 51.4% |
| Bhutanese | 99.7 /100 | #62 | Exceptional 51.4% |
| South Africans | 99.7 /100 | #63 | Exceptional 51.4% |
| Immigrants | Netherlands | 99.7 /100 | #64 | Exceptional 51.4% |
| Zimbabweans | 99.7 /100 | #65 | Exceptional 51.3% |
| Immigrants | Europe | 99.7 /100 | #66 | Exceptional 51.3% |
| Argentineans | 99.6 /100 | #67 | Exceptional 51.2% |
| Immigrants | Indonesia | 99.5 /100 | #68 | Exceptional 51.0% |
| Egyptians | 99.5 /100 | #69 | Exceptional 50.9% |
| Immigrants | Argentina | 99.5 /100 | #70 | Exceptional 50.9% |
| Immigrants | Romania | 99.5 /100 | #71 | Exceptional 50.9% |
| Immigrants | Pakistan | 99.5 /100 | #72 | Exceptional 50.9% |
| Carpatho Rusyns | 99.3 /100 | #73 | Exceptional 50.6% |
| Lithuanians | 99.3 /100 | #74 | Exceptional 50.6% |
| Immigrants | Scotland | 99.3 /100 | #75 | Exceptional 50.6% |
| Immigrants | Zimbabwe | 99.2 /100 | #76 | Exceptional 50.5% |
| Immigrants | Lebanon | 99.1 /100 | #77 | Exceptional 50.5% |