Immigrants from Zimbabwe vs Senegalese Associate's Degree
COMPARE
Immigrants from Zimbabwe
Senegalese
Associate's Degree
Associate's Degree Comparison
Immigrants from Zimbabwe
Senegalese
50.5%
ASSOCIATE'S DEGREE
99.2/ 100
METRIC RATING
76th/ 347
METRIC RANK
45.2%
ASSOCIATE'S DEGREE
21.1/ 100
METRIC RATING
200th/ 347
METRIC RANK
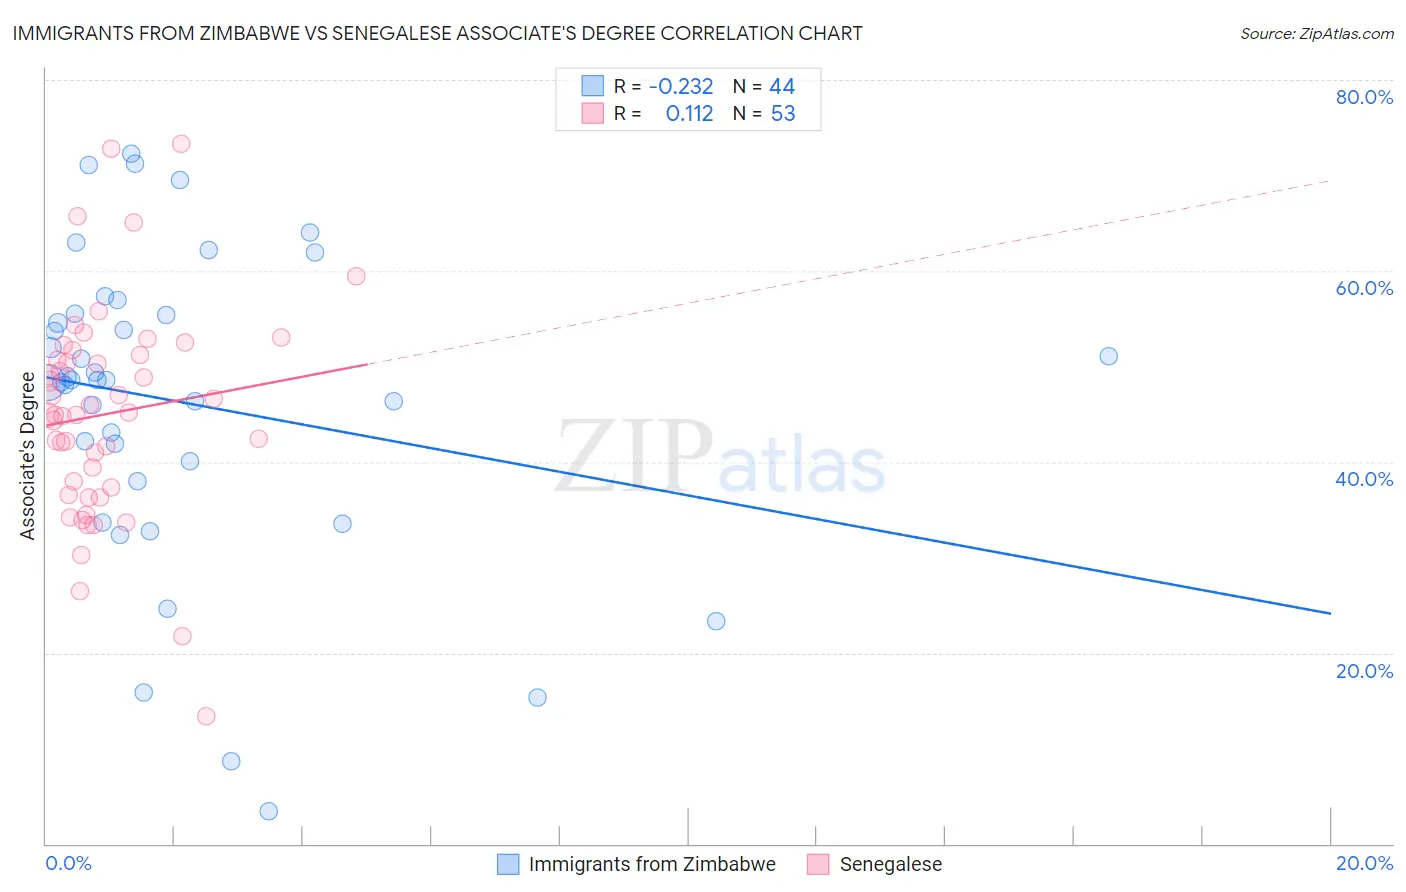
Immigrants from Zimbabwe vs Senegalese Associate's Degree Correlation Chart
The statistical analysis conducted on geographies consisting of 117,809,864 people shows a weak negative correlation between the proportion of Immigrants from Zimbabwe and percentage of population with at least associate's degree education in the United States with a correlation coefficient (R) of -0.232 and weighted average of 50.5%. Similarly, the statistical analysis conducted on geographies consisting of 78,136,633 people shows a poor positive correlation between the proportion of Senegalese and percentage of population with at least associate's degree education in the United States with a correlation coefficient (R) of 0.112 and weighted average of 45.2%, a difference of 11.7%.
Associate's Degree Correlation Summary
| Measurement | Immigrants from Zimbabwe | Senegalese |
| Minimum | 3.5% | 13.4% |
| Maximum | 72.3% | 73.4% |
| Range | 68.9% | 60.0% |
| Mean | 46.2% | 45.0% |
| Median | 48.6% | 44.9% |
| Interquartile 25% (IQ1) | 39.0% | 36.9% |
| Interquartile 75% (IQ3) | 55.5% | 51.4% |
| Interquartile Range (IQR) | 16.4% | 14.5% |
| Standard Deviation (Sample) | 16.2% | 11.3% |
| Standard Deviation (Population) | 16.0% | 11.2% |
Similar Demographics by Associate's Degree
Demographics Similar to Immigrants from Zimbabwe by Associate's Degree
In terms of associate's degree, the demographic groups most similar to Immigrants from Zimbabwe are Immigrants from Lebanon (50.5%, a difference of 0.030%), Immigrants from Eastern Europe (50.5%, a difference of 0.080%), Ethiopian (50.4%, a difference of 0.090%), Armenian (50.4%, a difference of 0.12%), and Maltese (50.4%, a difference of 0.19%).
| Demographics | Rating | Rank | Associate's Degree |
| Egyptians | 99.5 /100 | #69 | Exceptional 50.9% |
| Immigrants | Argentina | 99.5 /100 | #70 | Exceptional 50.9% |
| Immigrants | Romania | 99.5 /100 | #71 | Exceptional 50.9% |
| Immigrants | Pakistan | 99.5 /100 | #72 | Exceptional 50.9% |
| Carpatho Rusyns | 99.3 /100 | #73 | Exceptional 50.6% |
| Lithuanians | 99.3 /100 | #74 | Exceptional 50.6% |
| Immigrants | Scotland | 99.3 /100 | #75 | Exceptional 50.6% |
| Immigrants | Zimbabwe | 99.2 /100 | #76 | Exceptional 50.5% |
| Immigrants | Lebanon | 99.1 /100 | #77 | Exceptional 50.5% |
| Immigrants | Eastern Europe | 99.1 /100 | #78 | Exceptional 50.5% |
| Ethiopians | 99.1 /100 | #79 | Exceptional 50.4% |
| Armenians | 99.1 /100 | #80 | Exceptional 50.4% |
| Maltese | 99.1 /100 | #81 | Exceptional 50.4% |
| Greeks | 98.9 /100 | #82 | Exceptional 50.3% |
| Immigrants | Uzbekistan | 98.9 /100 | #83 | Exceptional 50.3% |
Demographics Similar to Senegalese by Associate's Degree
In terms of associate's degree, the demographic groups most similar to Senegalese are Immigrants from Senegal (45.2%, a difference of 0.010%), Immigrants from Bangladesh (45.2%, a difference of 0.030%), Immigrants from Vietnam (45.2%, a difference of 0.030%), Spaniard (45.2%, a difference of 0.080%), and Immigrants from South Eastern Asia (45.2%, a difference of 0.10%).
| Demographics | Rating | Rank | Associate's Degree |
| Immigrants | Cameroon | 31.0 /100 | #193 | Fair 45.7% |
| Immigrants | Peru | 27.6 /100 | #194 | Fair 45.5% |
| Germans | 26.5 /100 | #195 | Fair 45.5% |
| French | 25.6 /100 | #196 | Fair 45.4% |
| Scotch-Irish | 22.3 /100 | #197 | Fair 45.3% |
| Immigrants | Bangladesh | 21.3 /100 | #198 | Fair 45.2% |
| Immigrants | Senegal | 21.2 /100 | #199 | Fair 45.2% |
| Senegalese | 21.1 /100 | #200 | Fair 45.2% |
| Immigrants | Vietnam | 20.8 /100 | #201 | Fair 45.2% |
| Spaniards | 20.4 /100 | #202 | Fair 45.2% |
| Immigrants | South Eastern Asia | 20.2 /100 | #203 | Fair 45.2% |
| Nigerians | 19.1 /100 | #204 | Poor 45.1% |
| Immigrants | Thailand | 18.9 /100 | #205 | Poor 45.1% |
| German Russians | 18.9 /100 | #206 | Poor 45.1% |
| Panamanians | 18.4 /100 | #207 | Poor 45.1% |