Immigrants from Zimbabwe vs Iraqi College, Under 1 year
COMPARE
Immigrants from Zimbabwe
Iraqi
College, Under 1 year
College, Under 1 year Comparison
Immigrants from Zimbabwe
Iraqis
68.9%
COLLEGE, UNDER 1 YEAR
99.2/ 100
METRIC RATING
67th/ 347
METRIC RANK
66.8%
COLLEGE, UNDER 1 YEAR
88.0/ 100
METRIC RATING
134th/ 347
METRIC RANK
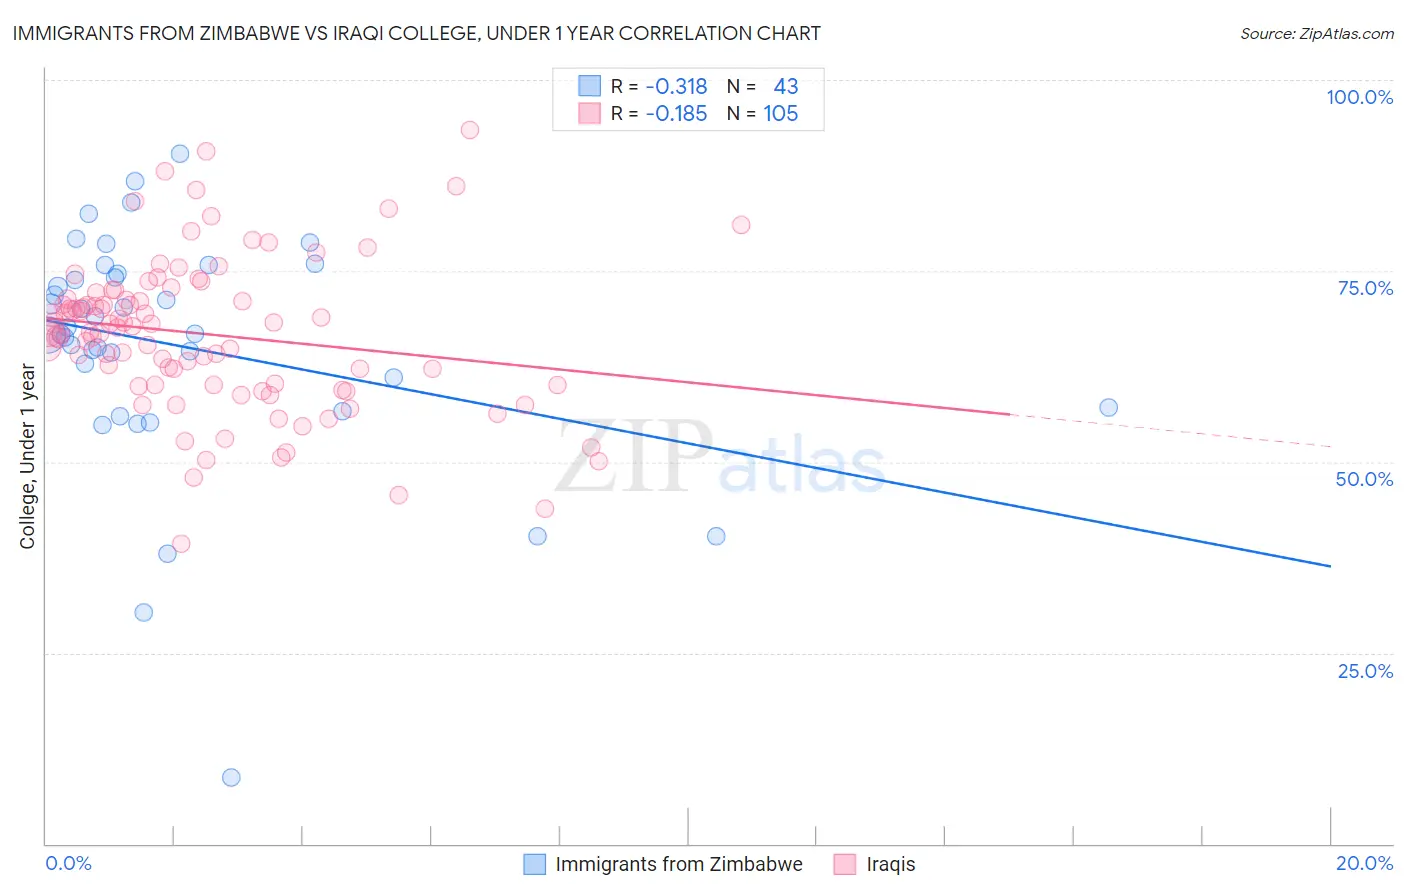
Immigrants from Zimbabwe vs Iraqi College, Under 1 year Correlation Chart
The statistical analysis conducted on geographies consisting of 117,809,691 people shows a mild negative correlation between the proportion of Immigrants from Zimbabwe and percentage of population with at least college, under 1 year education in the United States with a correlation coefficient (R) of -0.318 and weighted average of 68.9%. Similarly, the statistical analysis conducted on geographies consisting of 170,646,754 people shows a poor negative correlation between the proportion of Iraqis and percentage of population with at least college, under 1 year education in the United States with a correlation coefficient (R) of -0.185 and weighted average of 66.8%, a difference of 3.1%.
College, Under 1 year Correlation Summary
| Measurement | Immigrants from Zimbabwe | Iraqi |
| Minimum | 8.7% | 39.2% |
| Maximum | 90.4% | 93.4% |
| Range | 81.8% | 54.2% |
| Mean | 65.1% | 66.7% |
| Median | 66.7% | 67.6% |
| Interquartile 25% (IQ1) | 57.1% | 60.1% |
| Interquartile 75% (IQ3) | 74.7% | 71.8% |
| Interquartile Range (IQR) | 17.5% | 11.7% |
| Standard Deviation (Sample) | 15.5% | 10.0% |
| Standard Deviation (Population) | 15.3% | 9.9% |
Similar Demographics by College, Under 1 year
Demographics Similar to Immigrants from Zimbabwe by College, Under 1 year
In terms of college, under 1 year, the demographic groups most similar to Immigrants from Zimbabwe are Immigrants from Indonesia (68.9%, a difference of 0.030%), Immigrants from Romania (68.9%, a difference of 0.050%), Immigrants from North America (69.0%, a difference of 0.14%), Immigrants from Moldova (69.0%, a difference of 0.17%), and Northern European (69.0%, a difference of 0.18%).
| Demographics | Rating | Rank | College, Under 1 year |
| Immigrants | Asia | 99.5 /100 | #60 | Exceptional 69.2% |
| Immigrants | Kazakhstan | 99.5 /100 | #61 | Exceptional 69.2% |
| Immigrants | Belarus | 99.5 /100 | #62 | Exceptional 69.2% |
| Immigrants | Canada | 99.4 /100 | #63 | Exceptional 69.1% |
| Northern Europeans | 99.4 /100 | #64 | Exceptional 69.0% |
| Immigrants | Moldova | 99.3 /100 | #65 | Exceptional 69.0% |
| Immigrants | North America | 99.3 /100 | #66 | Exceptional 69.0% |
| Immigrants | Zimbabwe | 99.2 /100 | #67 | Exceptional 68.9% |
| Immigrants | Indonesia | 99.2 /100 | #68 | Exceptional 68.9% |
| Immigrants | Romania | 99.2 /100 | #69 | Exceptional 68.9% |
| Lithuanians | 99.1 /100 | #70 | Exceptional 68.8% |
| Immigrants | Europe | 99.1 /100 | #71 | Exceptional 68.8% |
| Bolivians | 99.0 /100 | #72 | Exceptional 68.7% |
| Immigrants | England | 99.0 /100 | #73 | Exceptional 68.7% |
| Swedes | 98.9 /100 | #74 | Exceptional 68.7% |
Demographics Similar to Iraqis by College, Under 1 year
In terms of college, under 1 year, the demographic groups most similar to Iraqis are Canadian (66.8%, a difference of 0.010%), Ugandan (66.8%, a difference of 0.020%), Immigrants from Brazil (66.9%, a difference of 0.030%), Polish (66.9%, a difference of 0.050%), and Finnish (66.9%, a difference of 0.060%).
| Demographics | Rating | Rank | College, Under 1 year |
| Czechs | 90.8 /100 | #127 | Exceptional 67.1% |
| Scottish | 90.2 /100 | #128 | Exceptional 67.0% |
| Immigrants | Eastern Africa | 89.5 /100 | #129 | Excellent 67.0% |
| Immigrants | Syria | 89.0 /100 | #130 | Excellent 66.9% |
| Finns | 88.6 /100 | #131 | Excellent 66.9% |
| Poles | 88.4 /100 | #132 | Excellent 66.9% |
| Immigrants | Brazil | 88.3 /100 | #133 | Excellent 66.9% |
| Iraqis | 88.0 /100 | #134 | Excellent 66.8% |
| Canadians | 87.9 /100 | #135 | Excellent 66.8% |
| Ugandans | 87.8 /100 | #136 | Excellent 66.8% |
| Immigrants | Chile | 87.4 /100 | #137 | Excellent 66.8% |
| Immigrants | Italy | 86.9 /100 | #138 | Excellent 66.8% |
| Venezuelans | 85.9 /100 | #139 | Excellent 66.7% |
| Slavs | 85.9 /100 | #140 | Excellent 66.7% |
| Immigrants | Afghanistan | 85.1 /100 | #141 | Excellent 66.7% |