Immigrants from Zimbabwe vs Menominee In Labor Force | Age 20-64
COMPARE
Immigrants from Zimbabwe
Menominee
In Labor Force | Age 20-64
In Labor Force | Age 20-64 Comparison
Immigrants from Zimbabwe
Menominee
80.5%
IN LABOR FORCE | AGE 20-64
99.8/ 100
METRIC RATING
40th/ 347
METRIC RANK
75.3%
IN LABOR FORCE | AGE 20-64
0.0/ 100
METRIC RATING
325th/ 347
METRIC RANK
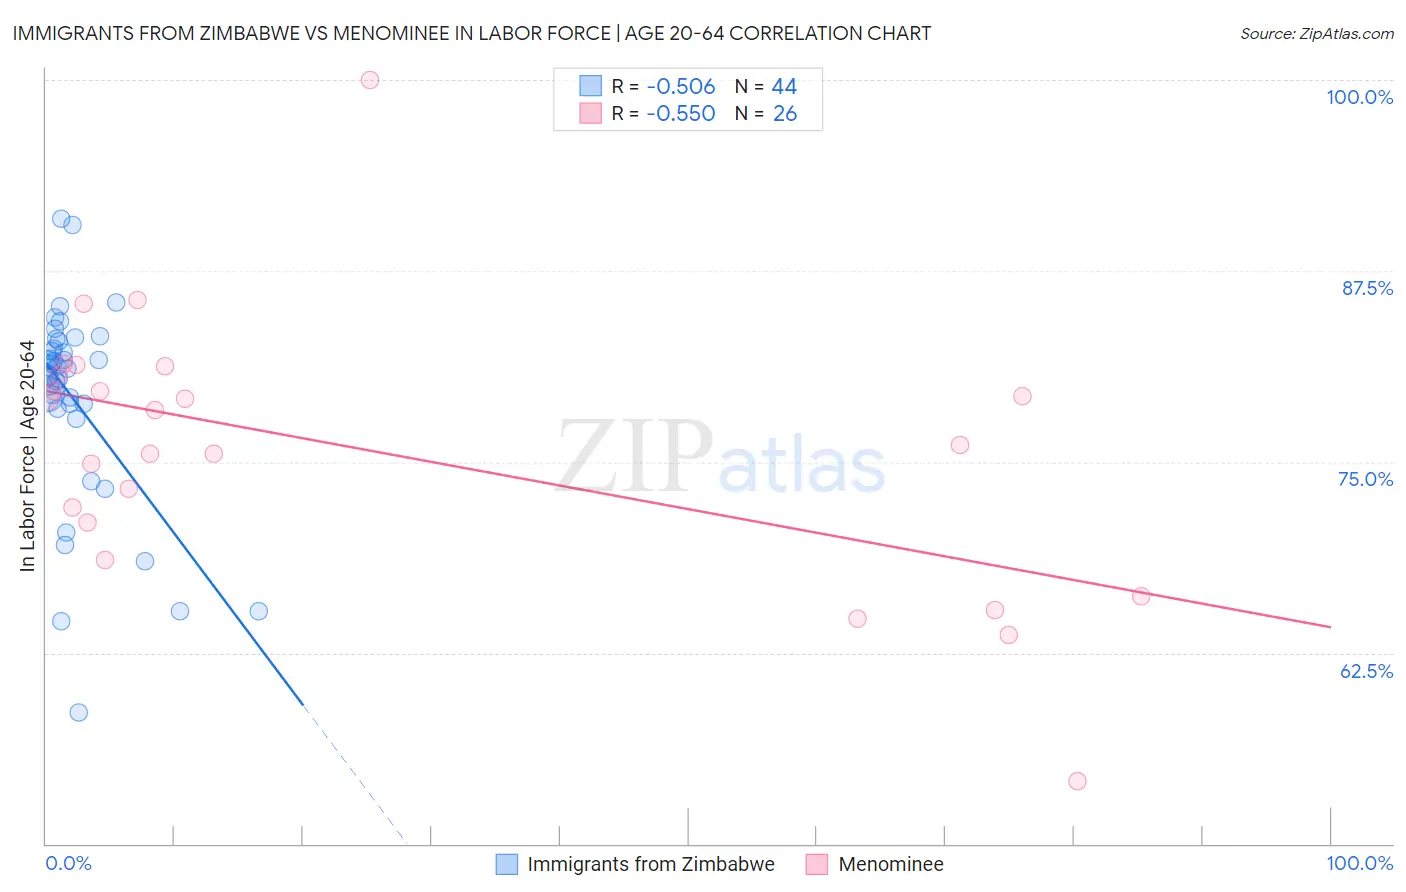
Immigrants from Zimbabwe vs Menominee In Labor Force | Age 20-64 Correlation Chart
The statistical analysis conducted on geographies consisting of 117,813,548 people shows a substantial negative correlation between the proportion of Immigrants from Zimbabwe and labor force participation rate among population between the ages 20 and 64 in the United States with a correlation coefficient (R) of -0.506 and weighted average of 80.5%. Similarly, the statistical analysis conducted on geographies consisting of 45,777,849 people shows a substantial negative correlation between the proportion of Menominee and labor force participation rate among population between the ages 20 and 64 in the United States with a correlation coefficient (R) of -0.550 and weighted average of 75.3%, a difference of 7.0%.
In Labor Force | Age 20-64 Correlation Summary
| Measurement | Immigrants from Zimbabwe | Menominee |
| Minimum | 58.6% | 54.1% |
| Maximum | 90.9% | 100.0% |
| Range | 32.3% | 45.9% |
| Mean | 79.1% | 75.8% |
| Median | 81.1% | 77.2% |
| Interquartile 25% (IQ1) | 78.6% | 71.0% |
| Interquartile 75% (IQ3) | 82.7% | 80.7% |
| Interquartile Range (IQR) | 4.0% | 9.7% |
| Standard Deviation (Sample) | 6.7% | 8.9% |
| Standard Deviation (Population) | 6.6% | 8.8% |
Similar Demographics by In Labor Force | Age 20-64
Demographics Similar to Immigrants from Zimbabwe by In Labor Force | Age 20-64
In terms of in labor force | age 20-64, the demographic groups most similar to Immigrants from Zimbabwe are Brazilian (80.5%, a difference of 0.0%), Ugandan (80.6%, a difference of 0.010%), Immigrants from Liberia (80.5%, a difference of 0.010%), Paraguayan (80.6%, a difference of 0.030%), and Immigrants from Moldova (80.6%, a difference of 0.030%).
| Demographics | Rating | Rank | In Labor Force | Age 20-64 |
| Chinese | 99.9 /100 | #33 | Exceptional 80.7% |
| Immigrants | Brazil | 99.9 /100 | #34 | Exceptional 80.7% |
| Immigrants | Poland | 99.9 /100 | #35 | Exceptional 80.6% |
| Paraguayans | 99.8 /100 | #36 | Exceptional 80.6% |
| Immigrants | Moldova | 99.8 /100 | #37 | Exceptional 80.6% |
| Ugandans | 99.8 /100 | #38 | Exceptional 80.6% |
| Brazilians | 99.8 /100 | #39 | Exceptional 80.5% |
| Immigrants | Zimbabwe | 99.8 /100 | #40 | Exceptional 80.5% |
| Immigrants | Liberia | 99.8 /100 | #41 | Exceptional 80.5% |
| Latvians | 99.8 /100 | #42 | Exceptional 80.5% |
| Czechs | 99.7 /100 | #43 | Exceptional 80.5% |
| Immigrants | Middle Africa | 99.7 /100 | #44 | Exceptional 80.5% |
| Slovenes | 99.7 /100 | #45 | Exceptional 80.5% |
| Immigrants | Pakistan | 99.6 /100 | #46 | Exceptional 80.5% |
| Immigrants | Africa | 99.6 /100 | #47 | Exceptional 80.4% |
Demographics Similar to Menominee by In Labor Force | Age 20-64
In terms of in labor force | age 20-64, the demographic groups most similar to Menominee are Choctaw (75.4%, a difference of 0.14%), Cajun (75.5%, a difference of 0.19%), Creek (75.1%, a difference of 0.22%), Dutch West Indian (75.5%, a difference of 0.23%), and Seminole (75.5%, a difference of 0.28%).
| Demographics | Rating | Rank | In Labor Force | Age 20-64 |
| Chickasaw | 0.0 /100 | #318 | Tragic 76.2% |
| Inupiat | 0.0 /100 | #319 | Tragic 76.1% |
| Yakama | 0.0 /100 | #320 | Tragic 75.8% |
| Seminole | 0.0 /100 | #321 | Tragic 75.5% |
| Dutch West Indians | 0.0 /100 | #322 | Tragic 75.5% |
| Cajuns | 0.0 /100 | #323 | Tragic 75.5% |
| Choctaw | 0.0 /100 | #324 | Tragic 75.4% |
| Menominee | 0.0 /100 | #325 | Tragic 75.3% |
| Creek | 0.0 /100 | #326 | Tragic 75.1% |
| Sioux | 0.0 /100 | #327 | Tragic 75.0% |
| Kiowa | 0.0 /100 | #328 | Tragic 75.0% |
| Cheyenne | 0.0 /100 | #329 | Tragic 74.8% |
| Colville | 0.0 /100 | #330 | Tragic 74.8% |
| Paiute | 0.0 /100 | #331 | Tragic 74.7% |
| Arapaho | 0.0 /100 | #332 | Tragic 74.4% |